A chart screenshot holds more information than most traders use. Every candle records four prices for its period: where price opened, how high it went, how low it went and where it closed. Read in sequence and in context, those candles tell you who was in control and whether that control is changing.
This guide gives you a repeatable way to read candlestick patterns from any screenshot, whether it comes from TradingView, a broker app or a phone.
Step 1: Know what one candle tells you
Each candle has two parts:
- The body is the range between the open and the close. A green (or hollow) body means the close was above the open. A red (or filled) body means the close was below the open.
- The wicks (also called shadows) show the highest and lowest prices reached during the period.
What matters is the relationship between them:
- A long body with short wicks means one side controlled the whole period. Buyers if green, sellers if red.
- A small body with long wicks means price travelled far but ended near where it started. Neither side won. This is indecision.
- A long lower wick means sellers pushed price down, then buyers pushed it back up before the close. That is rejection of lower prices.
- A long upper wick means the opposite: buyers pushed up and sellers rejected it.
Before naming any pattern, read the last five to ten candles this way. You will often see the story before you see the pattern.
Step 2: Check the settings visible on the screenshot
A screenshot can mislead if you skip the basics. Look for:
- The timeframe. A hammer on a 1 minute chart and a hammer on a daily chart are not the same signal. Higher timeframes carry more weight because more trading went into each candle.
- The market and session. Thin trading hours can print long wicks that mean little.
- The price scale. Check whether the chart is on a linear or log scale and how zoomed in it is. A candle that looks huge may be a small move on a tightly zoomed chart.
Step 3: Learn the patterns that matter
There are dozens of named patterns. A handful cover most of what you will see:
Single candle patterns
- Hammer: small body near the top of the range, lower wick at least twice the body, little or no upper wick. After a decline it shows buyers rejecting lower prices.
- Shooting star: the mirror image. Small body near the bottom, long upper wick. After a rally it shows sellers rejecting higher prices.
- Doji: open and close almost equal. Indecision. On its own it says little; after a strong move it can warn that momentum is fading.
Two candle patterns
- Bullish engulfing: a red candle followed by a green candle whose body fully covers the red body. Buyers overwhelmed the previous session's sellers.
- Bearish engulfing: the reverse, a green candle swallowed by a larger red body.
- Inside bar: a candle whose full range sits inside the previous candle's range. Compression. Often comes before a breakout in either direction.
Three candle patterns
- Morning star: a strong red candle, a small indecision candle, then a strong green candle closing well into the first candle's body. A reversal sign after a decline.
- Evening star: the same structure flipped, after a rally.
Step 4: Judge the pattern in context
This is where most beginners go wrong. A pattern is only as good as where it appears. Ask three questions:
- Is it at a meaningful level? A hammer in the middle of nowhere is noise. A hammer that touches a well tested support level is information. If you are not sure how to find those levels, read support and resistance for beginners.
- Does it fit or fight the trend? A bullish engulfing candle inside an uptrend, at a pullback, lines up with the larger flow. The same candle in a strong downtrend is a counter-trend signal and needs more confirmation.
- Did the next candle confirm it? A hammer is a question. The next candle closing above the hammer's high is part of the answer.
Worked example
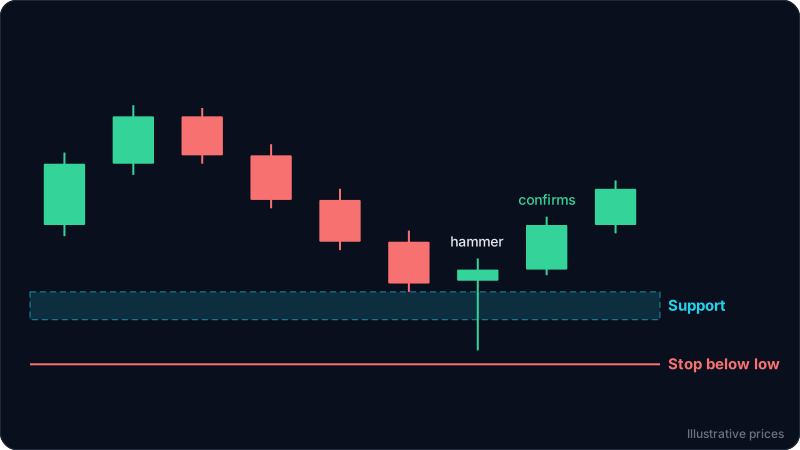
Imagine a 4 hour chart screenshot of a market that has risen for two weeks, then pulled back for three days. The prices below are illustrative.
- Price fell from 105 to 98 over the last six candles.
- 98 is the same level where price paused twice before the rally started. That makes it a support zone.
- The latest candle opened at 99, dropped to 96.5, then closed at 99.4. Its body is small and near the top, and the lower wick is about four times the body. That is a hammer.
- The candle after it opened at 99.4 and closed at 101, above the hammer's high of 99.8.
Reading it in order: the trend is up, price pulled back into a known support zone, sellers tried to push through and were rejected, and the next candle confirmed buyers stepping in. That is a pattern with context.
A trader using this read might plan an entry near 99 to 100, place a stop below the hammer's low with a small buffer (around 96), and look at the recent high near 105 as a first target. Placing that stop well is its own skill, covered in how to set a stop loss.
Now flip one detail. If the same hammer had formed at 101.5, in empty space with no prior reaction, it would be far weaker. Same candle, different context, different meaning.
This is an educational example, not financial advice or a trade recommendation.
Common mistakes
- Naming patterns on every candle. Most candles are just candles. Look for patterns only at levels that matter.
- Ignoring the close. Until a candle closes, it is not finished. A hammer can turn into a plain red candle in the last minutes of the period.
- Trusting one timeframe. Zoom out once before acting. A bullish pattern on the 15 minute chart can sit right under daily resistance.
- Skipping risk. A good pattern does not remove the need for a stop. Patterns fail regularly.
A quick checklist for any screenshot
- What timeframe and market is this?
- What is the trend over the visible candles?
- Where are the obvious support and resistance zones?
- What do the last five to ten candles say about control?
- Is there a recognisable pattern at one of those zones?
- Has it been confirmed by the next candle?
- Where would the idea be proven wrong?
FAQ
Can you read candlestick patterns accurately from a screenshot?
Yes, as long as the screenshot shows the candles clearly, the timeframe is known and enough history is visible to judge the trend and key levels. A cropped image with only a few candles gives much less to work with.
Which candlestick pattern is the most reliable?
No pattern is reliable on its own. Engulfing candles and hammers at clear support or resistance, in the direction of the larger trend and with confirmation, tend to be more useful than the same patterns in isolation.
Do candlestick patterns work on crypto, forex and stocks?
They describe buying and selling pressure, so they apply to any market with open, high, low and close data. Markets that trade around the clock, like crypto, have no session gaps, so gap based patterns appear less often.
How many candles should I look at before naming a pattern?
Look at the last five to ten candles for the immediate story, and zoom out to see at least the prior trend and the nearest support and resistance zones before deciding what a pattern means.
Try it on your own chart
ChartEdge AI reads a chart screenshot the same way: trend, key levels, candle behaviour, then a plan with entry, stop loss and targets. You can try it on your next chart with 3 free analyses and no card.