A stop loss is the price where you accept that your trade idea was wrong and exit. It is the single most important number in a trade plan, more important than the entry, because it decides how much you can lose.
This guide covers where to place a stop, how to use volatility to avoid getting stopped by noise, and how the stop decides your position size.
The one rule: place the stop where the idea is wrong
A stop should not be a random distance or a dollar amount you are comfortable losing. It should sit at the price that invalidates the reason you entered.
Ask: "If price reaches this level, is my reason for the trade still true?" If the answer is no, that is roughly where the stop belongs.
Examples:
- You bought a bounce from support. The idea is wrong if price closes clearly below that support zone.
- You bought a breakout above resistance. The idea is wrong if price falls back inside the old range.
- You bought a hammer candle. The idea is wrong if price trades below the hammer's low.
Once you have the invalidation point, you work out the size of the position from it, not the other way around.
Method 1: structure based stops
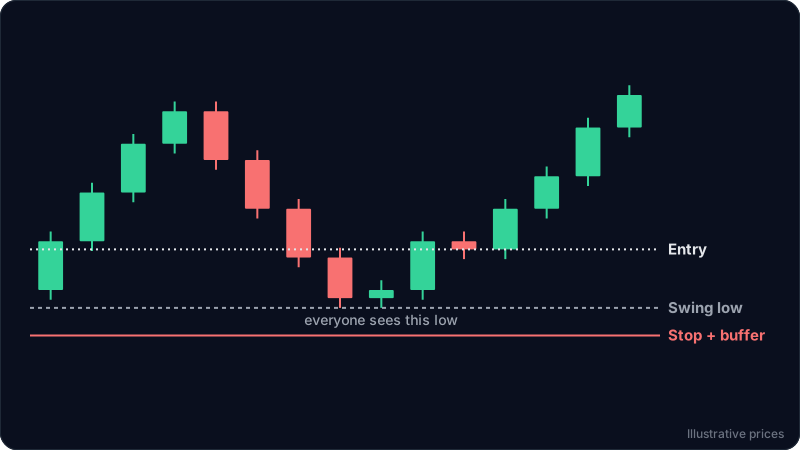
This is the most common and the most logical approach. Use the chart's own structure:
- For a long trade, place the stop below the most recent swing low or below the support zone you are trading from.
- For a short trade, place it above the most recent swing high or above the resistance zone.
If you need a refresher on finding those zones, see support and resistance for beginners.
Always add a buffer. Many traders see the same swing low, and a stop placed exactly on it is easy to reach with a single wick. A small buffer beyond the level means price must actually break the structure, not just poke it.
Method 2: volatility based stops
How big should the buffer be? Volatility answers that. A market that moves 2 percent a day on average needs a wider stop than one that moves 0.3 percent.
The Average True Range (ATR) indicator measures typical candle range over a period, often 14 candles. Two practical ways to use it:
- As a buffer: place the stop beyond structure by about 0.5 to 1 ATR.
- As a sanity check: if your structure stop is closer than about 1 ATR from entry, normal candle movement can hit it. Either find a better entry closer to the level or skip the trade.
The ATR stop loss guide shows both on 5 and 15 minute gold and forex charts, with the sizing.
Volatility changes. A stop size that worked last month can be too tight when the market gets busier, so measure it again on each trade.
Method 3: time and candle stops
Some setups have a time element. If you buy expecting a quick move and price goes sideways for hours, the idea may already be failing even though the price stop has not been touched. Some traders exit if price has not moved in their favour within a set number of candles. This is a supplement to a price stop, not a replacement.
Size the position from the stop
This is the step that keeps losses small and consistent. Decide what fraction of your account you will risk on one trade. Many traders use 0.5 to 2 percent. Then:
Position size = (account size x risk percent) / (entry price - stop price)
The wider the stop, the smaller the position. That way a wide stop and a tight stop both lose the same amount of money if they are hit.
Worked example
The numbers below are illustrative.
- Account: $5,000. Risk per trade: 1 percent, so $50.
- You plan to buy a bounce from a support zone between 48.20 and 48.60.
- The latest swing low is 48.10.
- The 14 period ATR on your timeframe is 0.40.
- Entry: 48.90.
Structure says the idea is wrong below 48.10. Add a buffer of about half an ATR (0.20) and the stop goes at 47.90.
Distance from entry to stop: 48.90 - 47.90 = 1.00.
Position size: $50 / 1.00 = 50 units.
If the stop is hit, you lose about $50, plus any fees and slippage. If the next resistance zone is at 51.90, the target is 3.00 away, which gives a 1 to 3 risk to reward.
Now compare the "tight stop" version. A trader puts the stop at 48.50 to "risk less". That is only 0.40 away, exactly one ATR. One ordinary candle can reach it, and it sits inside the support zone the trade depends on. The trader will often be stopped out right before price moves in the planned direction.
If you found that support zone from a candlestick signal, the stop logic connects directly to the candle, as shown in how to read candlestick patterns from a screenshot.
This is an educational example, not financial advice or a trade recommendation.
Mistakes that turn small losses into big ones
- Moving the stop further away when price approaches it. This turns a planned loss into an unplanned one. Decide before entering and leave it.
- No stop at all. "I will watch it" fails the day you cannot watch it.
- Choosing the stop by dollar amount. Your comfort level is not a chart level. Fix the risk in money with position size, and the stop with structure.
- Stops exactly on round numbers or obvious lows. Add a buffer.
- Ignoring gaps and weekends. In markets that close, price can open beyond your stop. Size positions with that in mind.
Stop loss checklist
- What would prove this trade idea wrong?
- Which swing point or zone marks that?
- How big is the ATR buffer beyond it?
- Is the stop at least about 1 ATR from entry?
- What position size makes the loss at the stop equal to my fixed risk?
- Is the target far enough away to make the risk worth it?
FAQ
How far should a stop loss be from entry?
As far as the price that invalidates your trade idea, plus a buffer for normal volatility. There is no fixed number of pips or percent that works across markets. Measure the market's typical range with ATR and set position size from the stop distance.
Should I use a percentage stop like 2 percent below entry?
A fixed percentage ignores the chart. It is better to risk a fixed percentage of your account and let the chart decide where the stop goes, then adjust position size to match.
Is a mental stop loss good enough?
For most traders, no. A stop order in the market protects you when you are away or hesitant. A mental stop relies on acting perfectly at the worst moment.
Should I move my stop to break even?
Moving a stop to break even after price has moved well in your favour can protect a trade, but doing it too early often gets you stopped out by a normal pullback. A common approach is to move it only after price makes a new swing point beyond your entry.
Try it on your own chart
ChartEdge AI reads the structure on your screenshot and suggests a stop loss beyond the level that invalidates the setup, along with entry, targets and risk to reward. Try it with 3 free analyses, no card required.