Support and resistance are the first thing most experienced traders mark on a chart, and for good reason. They show where buyers and sellers have acted before, which is the best clue available about where they may act again.
This guide explains what the levels are, how to draw them without cluttering your chart, and how to use them to plan entries, stops and targets.
What support and resistance are
- Support is a price area where falling price has stopped and turned up before. Buyers showed up there.
- Resistance is a price area where rising price has stopped and turned down before. Sellers showed up there.
Why do these areas repeat? A few reasons work together:
- Traders who missed the first bounce place orders to buy if price returns.
- Traders who bought at a level and saw it fall want to sell when price gets back to their entry, to get out flat.
- Round numbers and previous highs and lows are visible to everyone, so many people watch the same prices.
None of this guarantees a reaction. It only means the odds of some reaction are higher there than in empty space.
Draw zones, not lines
Price rarely turns at the exact same tick twice. If you draw a single thin line, you will constantly see price pierce it and wonder whether the level broke.
Instead, draw a zone: a band that covers the area where reactions happened. A simple way:
- Find two or more clear turning points at roughly the same price.
- Draw the zone from the highest body close to the furthest wick in that cluster.
- If the zone ends up very wide relative to recent candles, you are probably merging two different levels. Split it.
On a phone screenshot, a zone is also much easier to see than a hairline.
How to find the levels on any chart
Work from the higher timeframe down:
- Zoom out. On the daily or weekly chart, mark the two or three most obvious turning areas near current price. These are your major levels.
- Step down one timeframe. Add the nearer levels that only show up here. Keep it to a few.
- Ignore levels far from price. A resistance level 40 percent above price is not useful for today's plan.
A clean chart with three to five zones beats a chart with fifteen lines.
Strong levels vs weak levels
Not every level deserves the same respect. A level tends to be stronger when:
- It has been tested several times and held, with clear reactions each time.
- The reactions were sharp. A fast move away from a level shows strong orders were sitting there.
- It shows on higher timeframes. A daily level outweighs a 5 minute level.
- It lines up with something else, such as a round number, a prior all time high or a trend line.
Be careful with one idea: every test also uses up some of the orders waiting at a level. A level hit five times in quick succession is often more likely to break than one hit twice.
Role reversal: when support becomes resistance
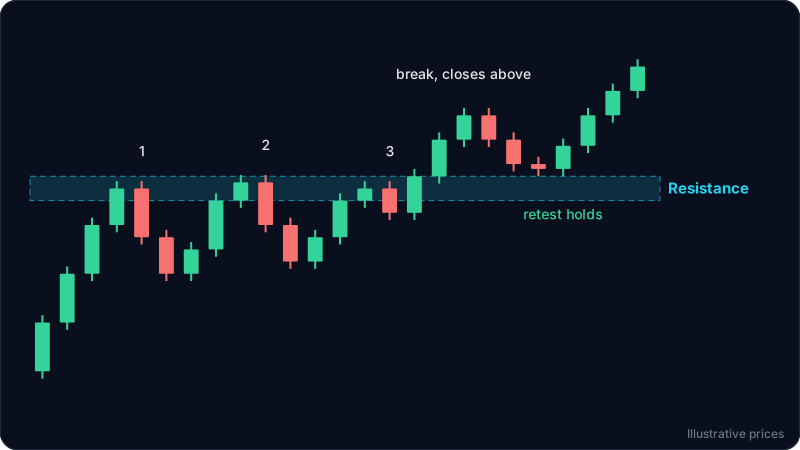
When price breaks cleanly through support and closes below it, that old support often acts as resistance on the way back up. The traders who bought there are now underwater and many will sell to get out when price returns. The same works in reverse for broken resistance becoming support.
This "break and retest" is one of the most practical patterns for beginners, because it gives a clear level to trade from and a clear point where the idea is wrong.
Worked example
Picture a 1 hour chart screenshot. The prices are illustrative.
- Over the past week, price turned down three times between 1.2480 and 1.2500. That is a resistance zone.
- Price has also bounced twice between 1.2380 and 1.2395. That is a support zone.
- Today price pushed through 1.2500, closed two hourly candles above it at 1.2520 and 1.2530, then pulled back to 1.2502.
- At 1.2502 the pullback printed a candle with a long lower wick and a close at 1.2515.
The read: old resistance at 1.2480 to 1.2500 was broken with closes above it, and price came back to test it from above. The long lower wick shows buyers defending the zone. That is a role reversal in progress. For more on reading that kind of candle, see how to read candlestick patterns from a screenshot.
A plan built on it could be:
- Entry: around 1.2510 to 1.2515, near the retest.
- Stop loss: below the zone, around 1.2470. If price closes back inside and below the old resistance, the breakout has failed. Choosing that spot is explained in how to set a stop loss.
- Target: the next resistance zone visible on the higher timeframe.
Risk here is about 40 to 45 pips. If the next resistance is 120 pips above entry, the trade offers roughly 1 to 2.7 risk to reward, which is worth considering. If it is only 30 pips away, the trade is not worth the risk even though the level looks good.
This is an educational example, not financial advice or a trade recommendation.
Common mistakes
- Drawing too many levels. If every price is a level, no price is.
- Expecting exact touches. Use zones and wait for a reaction or a close before acting.
- Buying support in a strong downtrend. In a clear downtrend, support levels break more often than they hold. Trade with the trend when you can.
- Placing stops exactly at the level. Everyone sees the same level. Stops sitting right on it get taken out by normal noise. Leave a buffer beyond the zone.
FAQ
How many times should a level be tested to count as support or resistance?
Two clear reactions are enough to mark a zone. Three or more make it more significant, but repeated tests in a short time can also weaken it as waiting orders get filled.
Should I use the wicks or the bodies to draw levels?
Use both: draw a zone from the cluster of candle closes to the furthest wicks. Bodies show where traders agreed on price at the close, wicks show how far the rejection reached.
What timeframe is best for support and resistance?
Start on the higher timeframe, such as daily, to find major levels, then refine on the timeframe you trade. Higher timeframe levels carry more weight.
What happens when support breaks?
A clean break with closes beyond the zone often turns the old support into resistance. Watch for a retest from below: if price rejects the zone, the break is more likely to hold.
Try it on your own chart
ChartEdge AI marks the key support and resistance zones on your screenshot, then builds a plan with an entry, a stop beyond the level and targets at the next zones. Try it free with 3 analyses, no card required.