AI chart analysis in seconds
Upload a screenshot of any chart and ChartEdge AI reads it the way a technical analyst would: trend, structure, patterns, support and resistance, then a complete trade plan with entry, stop loss and targets.
What you get from one screenshot
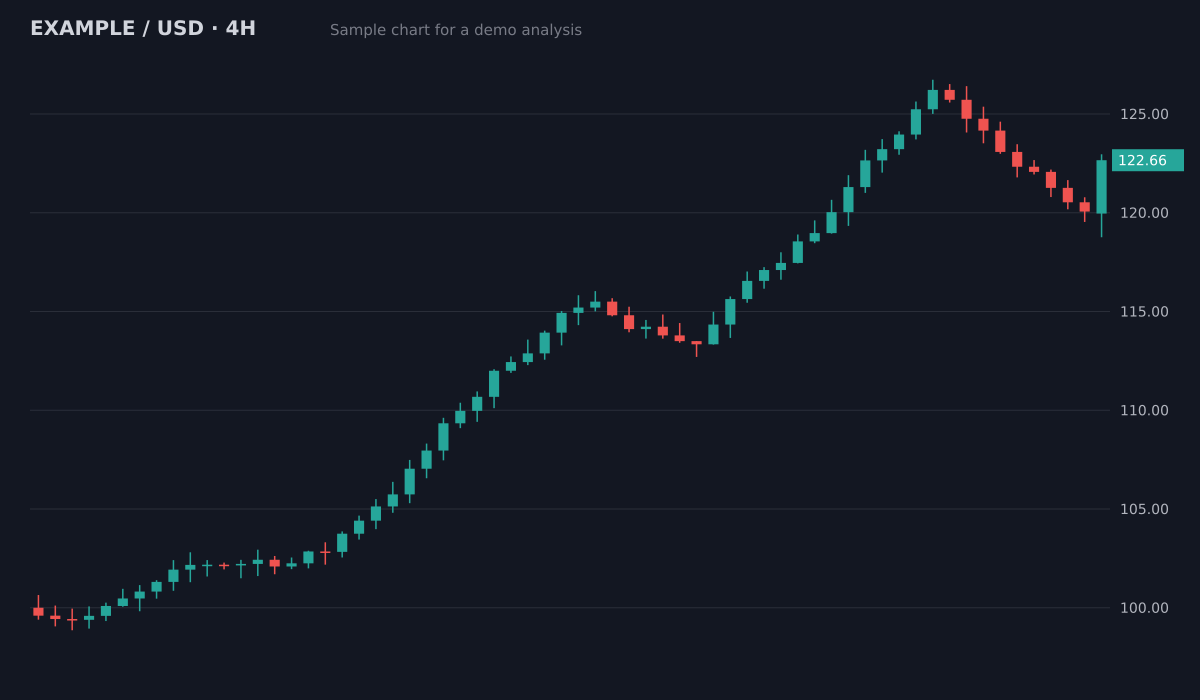
- Bias
- Bullish, pullback in an uptrend
- Structure
- Higher highs and higher lows since 100; pullback held above the 119.5 breakout area
- Key levels
- Resistance126.5 (swing high)
- Support119.5 to 120 (old breakout)
- Support113.5 to 115 (prior range)
- Plan
- Entry zone120.5 to 121.5
- Stop loss118.4
- Target 1126.5 (1:2.1)
- Target 2129.5 (1:3.3)
Invalid if a 4H candle closes below the 119.5 support. Size the position from the stop distance.
Sample chart with illustrative prices, not a live market. Educational, not financial advice.
Try it on your own chartScreenshot your chart
Any platform, any market, any timeframe. Candles and indicators visible on screen are enough.
Upload it
Drop the image into ChartEdge AI. No broker connection and no API keys needed.
Get the plan
Bias, setup, entry zone, stop loss, take profit levels and risk to reward, written in plain language.
Try it on your chart now
No account needed. Upload a screenshot and see the bias and key levels in seconds.
What the AI looks for
Market structure (higher highs and lows or the opposite), chart patterns such as flags, wedges, triangles and double tops, key horizontal levels, trendlines, and the indicators you have on the chart such as moving averages, RSI or volume.
Built for real decisions
Every analysis ends with a concrete plan you can check against your own view: where the idea is invalid, where to take profit, and how big the position should be with the built-in position sizer.
Every market you trade
Crypto (BTC, ETH, altcoins), forex pairs, indices, stocks and commodities like gold. If you can screenshot it, ChartEdge AI can analyse it.
Learn and plan for free
- Guide: How AI Chart Analysis Works
- Guide: How to Read a Trading Chart for Beginners
- Guide: ChatGPT vs a Dedicated AI Chart Tool
- Guide: How to Use AI for Trading Safely
- Free ChatGPT prompt for chart analysis
- Free position size calculator
- Free risk reward calculator
- AI chart analysis tools 2026: prices and free plans
Questions
Is AI chart analysis accurate?
The AI reads what is on the chart consistently and fast, but no analysis predicts the future. Use it as a second opinion and always manage risk. ChartEdge AI is not financial advice.
Do I need to connect my broker?
No. You only upload an image. ChartEdge AI never asks for broker or exchange access.
Can ChatGPT analyse a trading chart?
Yes, ChatGPT can describe a chart image. ChartEdge AI is built only for charts: every analysis returns the same structured plan (bias, key levels, entry, stop loss, targets, risk to reward), is saved to your dashboard, and feeds a position size calculator. The comparison page ChatGPT vs ChartEdge AI goes into detail.
What should I look for in an AI chart analysis tool?
A clear invalidation level (stop loss) on every plan, levels you can check on your own chart, the reasoning behind the bias, and honesty about limits: no tool can predict price.
What can't AI chart analysis do?
It cannot see news, order flow or anything outside the screenshot, and it cannot know the future. It reads the candles, levels and indicators in the image. Check the economic calendar and size every trade from the stop.
Which timeframe should I upload for AI chart analysis?
Upload the chart you plan to enter on, and the higher one too. Most day traders send the 1 hour chart for direction and the 5 or 15 minute chart for the entry; swing traders send the daily and the 4 hour. One analysis reads one screenshot, so two charts give the AI the bigger picture.
Can AI read indicators like RSI, MACD and moving averages?
Yes, when they are visible on the screenshot. It reads the indicator panes and lines that are drawn, such as RSI, MACD, moving averages or Bollinger Bands, along with the candles and levels. It cannot read settings or values that are hidden.
Which markets does AI chart analysis work on?
Any market with a price chart: crypto such as BTC and ETH, forex pairs such as EUR/USD, gold (XAU/USD), silver, oil, indices such as NAS100 and US30, and stocks. It reads the chart, not the market's news, so the same method applies to all of them.
Which AI chart analysis tools have a free plan?
Several do, with different limits: ChartEdge AI gives 3 free analyses with no card, ChartSnipe 2 a month, SnapPChart 2 in total, ChartingLens 1 AI credit a day on its own charts, and the Wick browser extension 7 days; ChatGPT's free plan includes limited image upload. Our list of AI chart analysis tools puts 10 of them side by side with the check date. Limits change, so check each site.
How much does it cost?
Your first 3 analyses are free with no card required. After that it is $20 per month, cancel anytime.
Try it on your next chart
Upload a screenshot and get a full trade plan in seconds.
3 free analyses. No card required.
Analyse your own chart in seconds
Try free