Gold chart analysis with AI
Screenshot your XAU/USD chart from MetaTrader, TradingView or your broker app and get a structured trade plan: trend, key levels, setup, entry, stop loss and targets.
What you get from one screenshot
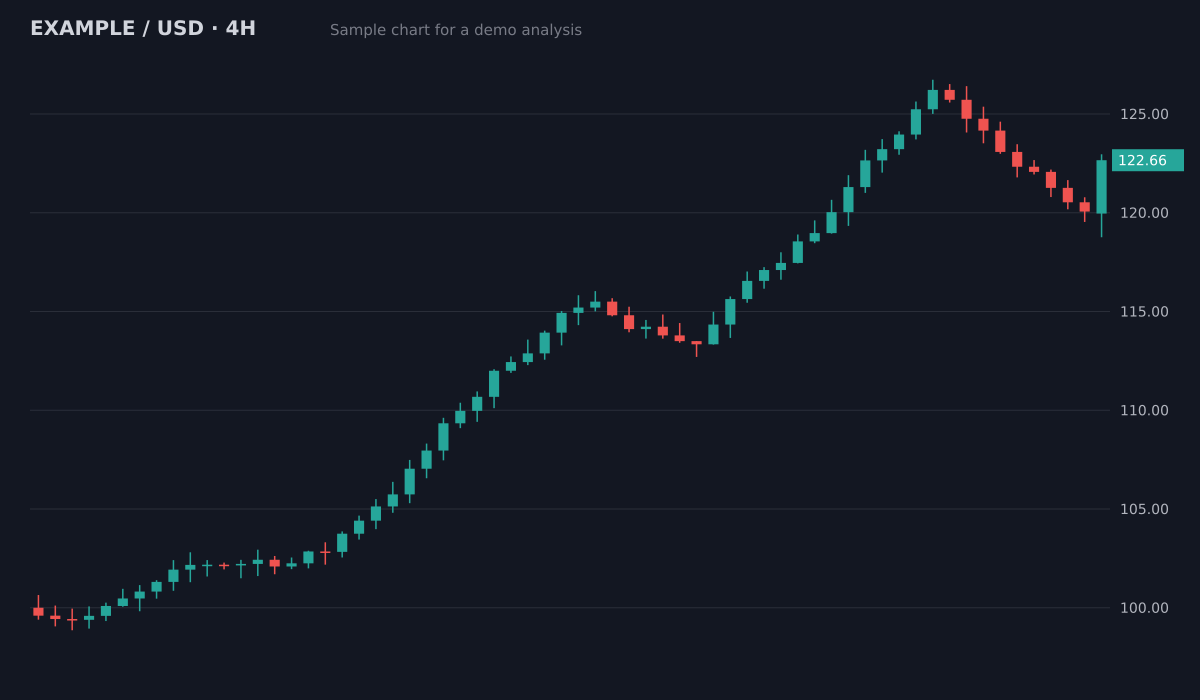
- Bias
- Bullish, pullback in an uptrend
- Structure
- Higher highs and higher lows since 100; pullback held above the 119.5 breakout area
- Key levels
- Resistance126.5 (swing high)
- Support119.5 to 120 (old breakout)
- Support113.5 to 115 (prior range)
- Plan
- Entry zone120.5 to 121.5
- Stop loss118.4
- Target 1126.5 (1:2.1)
- Target 2129.5 (1:3.3)
Invalid if a 4H candle closes below the 119.5 support. Size the position from the stop distance.
Sample chart with illustrative prices, not a live market. Educational, not financial advice.
Try it on your own chartScreenshot XAU/USD
From MT4, MT5, TradingView, cTrader or any broker app. Keep the price scale and timeframe visible.
Upload it
No broker login needed. ChartEdge AI only reads the image.
Get the plan
Bias, entry zone, stop loss, targets and risk to reward, with the reasoning behind each level.
Try it on your chart now
No account needed. Upload a screenshot and see the bias and key levels in seconds.
Session-aware reading
Gold often moves most around the London and New York sessions and around major US data releases. Check the session and the economic calendar alongside the plan, and expect wider spreads around news.
Round numbers and prior highs
Gold traders watch round numbers and previous swing highs and lows closely. ChartEdge AI marks the key horizontal levels visible on your chart and builds targets around them.
Volatility-sized stops
Gold can move quickly. Plans place the stop beyond structure, and the position sizer turns that distance into a position size that fits your risk.
Learn and plan for free
Questions
Does it work with MetaTrader screenshots?
Yes. Any clear screenshot of a gold chart works, including MT4 and MT5.
Can it trade gold for me?
No. ChartEdge AI gives an educational analysis and plan. You decide and place any trade yourself. It is not financial advice.
What does it cost?
3 free analyses with no card required, then $20 per month. Cancel anytime.
Can AI analyse an XAU/USD chart?
Yes. Upload a screenshot of any gold chart, spot or CFD, from MetaTrader, TradingView or your broker, and you get the trend, key levels, entry, stop loss and targets.
Why are stops on gold wider than on forex pairs?
Gold usually moves more dollars per hour than a major pair moves in pips, so a stop beyond a real level is often wide. Keep the risk in money fixed and size the position from the stop distance.
Does it use news like US inflation data or Fed decisions?
No. It reads the chart only. Gold often reacts sharply to US data and central bank news, so check the calendar yourself.
Which timeframe is best for analysing gold?
The 1 hour chart for direction and the 15 or 5 minute chart for entries suits most gold day traders; swing traders use the daily and the 4 hour. Uploading both charts gives the bigger picture.
When does gold move the most?
In the London session and the London and New York overlap, and around US data such as NFP and CPI. The quiet Asian hours often give smaller ranges and false breaks.
Should I trade gold during NFP or CPI?
Both come out at 13:30 UTC in winter, 12:30 UTC in summer. Most chart traders wait for the 15 minute release candle to close: the spread widens and stops can fill past their price. Then the cleaner trade is a retest of the pre-release high or low, stop beyond the pullback, as the New York open guide shows.
Why was my gold stop hit before the chart reached it?
Usually the spread. Most charts show the bid price, and a short trade closes at the ask, which sits higher by the spread. When the spread widens around news, the ask can touch your stop while the chart line stays below it.
How do I trade gold on the 15 minute chart?
Take the direction from the 1 hour chart and enter at a level on the 15 minute chart. Trade London or the New York overlap, put the stop beyond the swing with room for the spread, and size from the stop. Our gold 15 minute guide has an example.
How many lots should I trade on gold?
Size from the stop: lots = risk in dollars / (stop distance in dollars x 100), because 1 standard lot of XAU/USD is 100 ounces at most brokers. With a $20 risk and a $4 stop that is 0.05 lots. Check your broker's contract size first.
Does it read broker symbols like XAUUSDm or XAUUSD.r?
Yes. Broker suffixes such as m, .r, + or -ECN only mark the account type; the chart is still gold against the dollar, and the report reads it as XAU/USD. Spreads differ between account types, so check yours before placing the stop.
Try it on your next chart
Upload a screenshot and get a full trade plan in seconds.
3 free analyses. No card required.
Get a plan for your gold chart
Try free