Chart pattern recognition with AI
Upload a chart screenshot and ChartEdge AI identifies the pattern in play, where it is on the chart, what would confirm or break it, and the trade plan that follows from it.
What you get from one screenshot
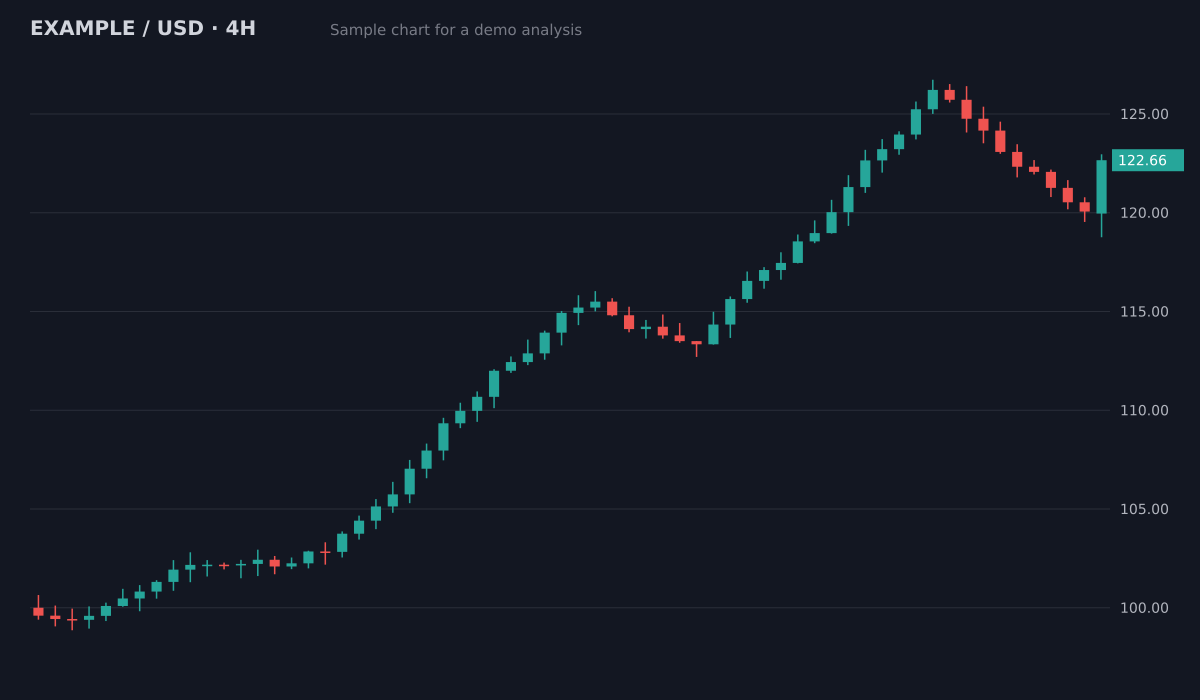
- Bias
- Bullish, pullback in an uptrend
- Structure
- Higher highs and higher lows since 100; pullback held above the 119.5 breakout area
- Key levels
- Resistance126.5 (swing high)
- Support119.5 to 120 (old breakout)
- Support113.5 to 115 (prior range)
- Plan
- Entry zone120.5 to 121.5
- Stop loss118.4
- Target 1126.5 (1:2.1)
- Target 2129.5 (1:3.3)
Invalid if a 4H candle closes below the 119.5 support. Size the position from the stop distance.
Sample chart with illustrative prices, not a live market. Educational, not financial advice.
Try it on your own chartUpload any chart
Any market and timeframe. Patterns are read from the candles and structure on the image.
See the pattern
Flags, pennants, triangles, wedges, channels, head and shoulders, double tops and bottoms, ranges and breakouts.
Get the plan
Confirmation level, invalidation level, entry, stop loss and targets, so the pattern becomes a decision you can check.
Try it on your chart now
No account needed. Upload a screenshot and see the bias and key levels in seconds.
Patterns in context
A pattern means little on its own. ChartEdge AI weighs it against the trend and the key levels on the chart, and calls a range a range when there is no clear pattern.
Confirmation and invalidation
Every pattern has a level that confirms it and a level that breaks it. The plan names both, so you know what to wait for and where the idea is wrong.
Learn as you go
The reasoning explains why a pattern was identified. Pair it with the free guides on candlestick patterns and support and resistance to build your own eye.
Questions
Which patterns can it recognise?
Common continuation and reversal patterns such as flags, triangles, wedges, channels, head and shoulders, double tops and bottoms, and candlestick signals at key levels.
Is pattern recognition reliable?
Patterns fail regularly. Recognition helps you see the setup faster, but every plan includes a stop loss for that reason. It is not financial advice.
What if my chart has no clear pattern?
It says so instead of forcing a shape. When no pattern is clear, the analysis calls the chart a range or a trend and builds the plan from the key levels.
Can it spot patterns on a 1 minute or 5 minute chart?
Yes, but patterns on very fast charts are less reliable, because a few candles of noise can form or break them. Check the same pattern on the 15M or 1H before trusting it, and keep the stop beyond the invalidation level.
What does it cost?
3 free analyses with no card required, then $20 per month.
Try it on your next chart
Upload a screenshot and get a full trade plan in seconds.
3 free analyses. No card required.
Spot the patterns on your chart
Try free