Crypto chart analysis with AI
Screenshot any coin's chart from your exchange or TradingView and get a structured read in seconds: trend, key levels, pattern, and a trade plan with entry, stop loss and targets.
What you get from one screenshot
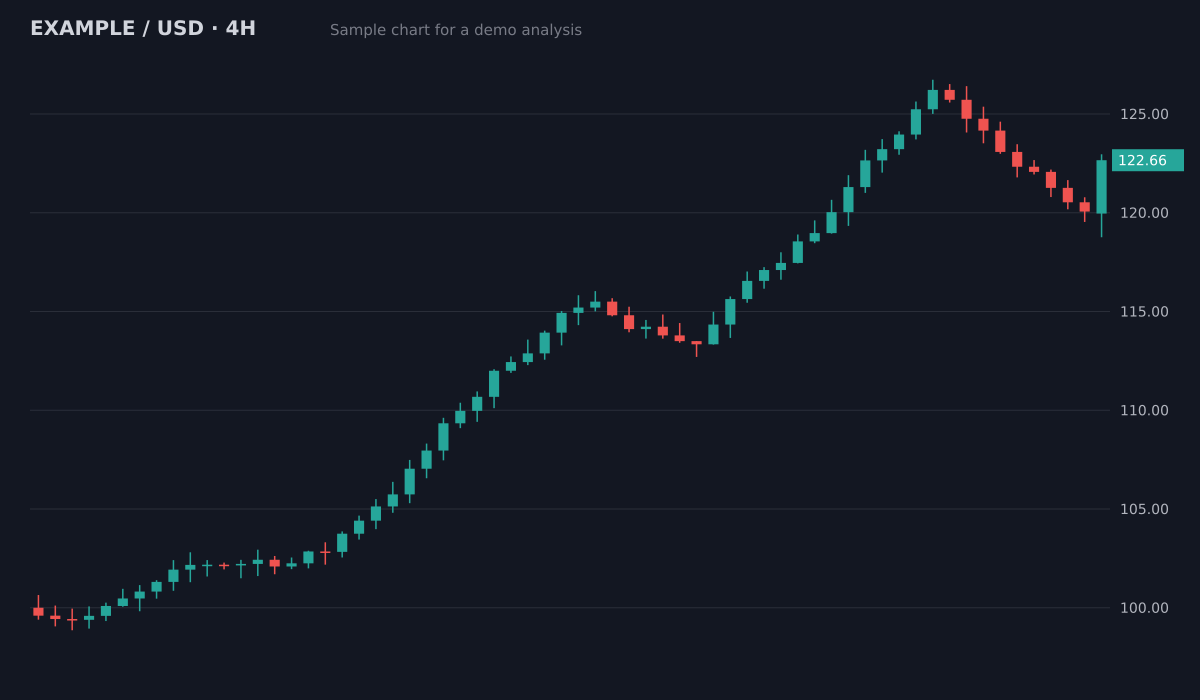
- Bias
- Bullish, pullback in an uptrend
- Structure
- Higher highs and higher lows since 100; pullback held above the 119.5 breakout area
- Key levels
- Resistance126.5 (swing high)
- Support119.5 to 120 (old breakout)
- Support113.5 to 115 (prior range)
- Plan
- Entry zone120.5 to 121.5
- Stop loss118.4
- Target 1126.5 (1:2.1)
- Target 2129.5 (1:3.3)
Invalid if a 4H candle closes below the 119.5 support. Size the position from the stop distance.
Sample chart with illustrative prices, not a live market. Educational, not financial advice.
Try it on your own chartPick any coin
BTC, ETH, SOL, XRP or a small-cap altcoin. Spot or perpetual charts both work.
Upload the screenshot
No exchange connection, no wallet, no API keys.
Get a plan
Bias, setup, entry zone, stop loss, targets and risk to reward, with the reasoning.
Try it on your chart now
No account needed. Upload a screenshot and see the bias and key levels in seconds.
Altcoins move harder
Smaller coins can move several times more than BTC in a day. Plans put the stop beyond structure, and the position sizer keeps the dollar risk the same however wide that stop is.
Leverage needs a plan
On perpetual futures, a stop that is too tight or a position that is too large can be liquidated by normal moves. Size from the stop, not from the leverage your exchange offers.
Check BTC first
Most altcoins follow Bitcoin's direction much of the time. Run your BTC chart too before acting on an altcoin plan.
Questions
Does it work with exchange screenshots?
Yes. Binance, Coinbase, Bybit, Kraken, TradingView or any other source, as long as the candles and price scale are visible.
Can it tell me which coin to buy?
No. It analyses the chart you upload. It does not pick coins and is not financial advice.
What does it cost?
3 free analyses with no card required, then $20 per month. Cancel anytime.
Can ChatGPT analyse a crypto chart, and how is ChartEdge different?
ChatGPT can describe a chart image if you ask. ChartEdge AI is built for this one job: every upload returns the same structured plan (bias, key levels, entry, stop loss, targets, risk reward) and it is saved in your history so you can compare charts later.
Which timeframe should I upload for crypto?
Any timeframe works. Many traders check the 4H or Daily for the bigger trend, then the 15m or 1H to time an entry. Crypto trades 24/7, so weekend candles can be thin and spiky.
Does it work on altcoins and small pairs?
Yes, if the candles and the price scale are visible. Thin markets have bigger wicks and more slippage, so levels on small coins are less reliable: size smaller there.
Does it work on futures and perpetual charts?
Yes. A perpetual or futures chart from Binance, Bybit or any exchange reads like a spot chart: candles, levels and structure. It does not see your leverage, so check your liquidation price before you size the trade.
Why do crypto stops get hit on weekends?
Weekend liquidity is thinner, so smaller orders move price further and wicks run past obvious levels. Wider zones and a smaller size help; the BTC weekend volatility guide explains the pattern.
Try it on your next chart
Upload a screenshot and get a full trade plan in seconds.
3 free analyses. No card required.
Get a plan for your crypto chart
Try free