Analyse your TradingView screenshots with AI
Take a snapshot of your TradingView chart, upload it, and get an instant second opinion on your setup. ChartEdge AI reads the candles, your drawings and your indicators, then writes a full trade plan.
What you get from one screenshot
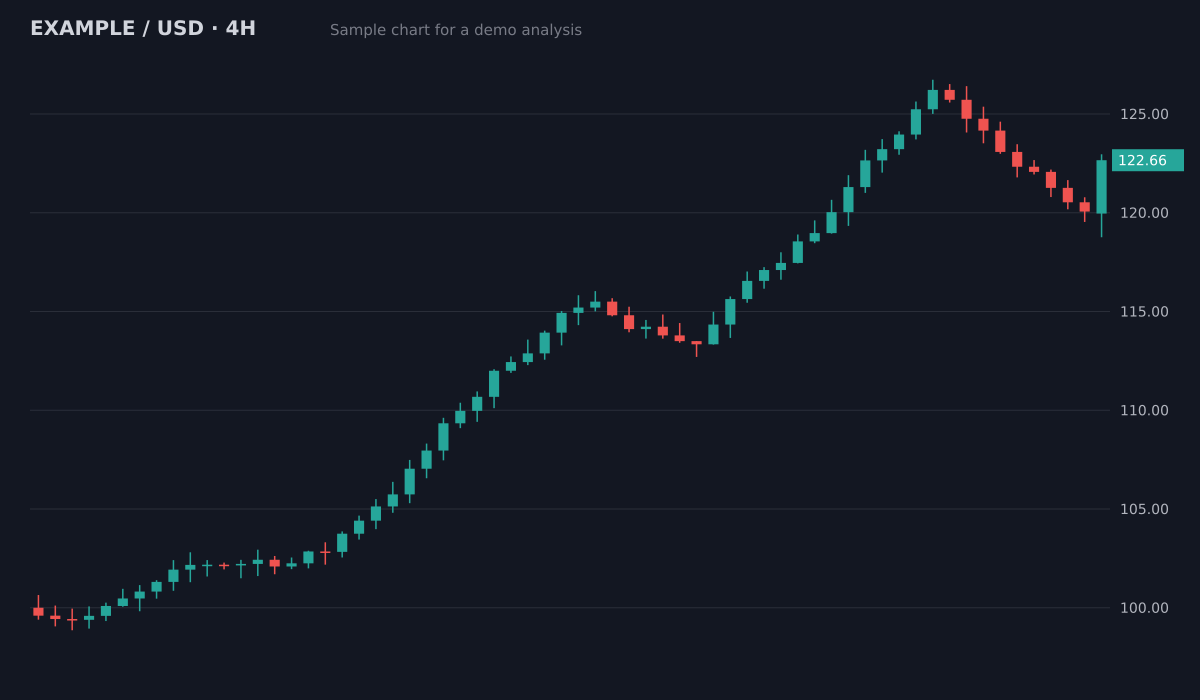
- Bias
- Bullish, pullback in an uptrend
- Structure
- Higher highs and higher lows since 100; pullback held above the 119.5 breakout area
- Key levels
- Resistance126.5 (swing high)
- Support119.5 to 120 (old breakout)
- Support113.5 to 115 (prior range)
- Plan
- Entry zone120.5 to 121.5
- Stop loss118.4
- Target 1126.5 (1:2.1)
- Target 2129.5 (1:3.3)
Invalid if a 4H candle closes below the 119.5 support. Size the position from the stop distance.
Sample chart with illustrative prices, not a live market. Educational, not financial advice.
Try it on your own chartTake a snapshot
Use the TradingView camera icon or any screenshot tool. Keep the price axis and timeframe visible.
Upload to ChartEdge AI
Drag the image in from your desktop or phone. It takes a few seconds.
Review the plan
See the bias, the pattern, key levels, entry, stop loss and targets next to your own analysis.
Try it on your chart now
No account needed. Upload a screenshot and see the bias and key levels in seconds.
Reads your own drawings
Trendlines, horizontal levels, Fibonacci retracements and channels you drew on TradingView are taken into account, together with indicators like EMAs, RSI, MACD and volume.
A second opinion before you click buy
Checking a setup against an independent read helps catch what you missed: a level just above your entry, a stretched RSI, or a target that leaves a poor risk to reward.
Keep a record
Every analysis is saved to your dashboard, and the trade journal lets you log what you actually did so you can review your decisions later.
Learn and plan for free
Questions
Does this connect to my TradingView account?
No. ChartEdge AI only needs the image. It does not log in to TradingView or read your account.
Which TradingView layouts work best?
A clean chart with visible candles, price axis and timeframe works best. Dark and light themes both work.
Is there a free trial?
Yes. Your first 3 analyses are free with no card required. Then it is $20 per month.
How do I save a clean TradingView chart image?
Use the camera (snapshot) button at the top of the chart to download the image, or take a normal screenshot in the TradingView phone app. Keep the symbol, timeframe and price scale on screen.
Can it read my drawings and indicators?
It sees the whole image, including your lines and common indicators such as moving averages or RSI. The plan is built from the candles and the price scale, so a few indicators help and many overlapping lines hide the candles.
Does it work with the TradingView phone app?
Yes. Screenshot the chart in the app, then upload it from your photos in Safari or Chrome. Turning the phone sideways gives a wider chart and a better read.
Does it work with the free TradingView plan?
Yes. It only needs a screenshot of the chart, which you can take on any TradingView plan, free or paid.
Can I analyse two timeframes of the same chart?
Yes. Upload one screenshot per timeframe, for example the 1 hour for direction and the 15 minute for the entry. Each upload gets its own report, so you can compare the two.
Try it on your next chart
Upload a screenshot and get a full trade plan in seconds.
3 free analyses. No card required.
Analyse your own chart in seconds
Try free