AI chart analysis for day trading
Day trading leaves little time to think. Screenshot your intraday chart, upload it, and get a structured read of the trend, the levels that matter today and a complete plan with entry, stop loss and targets before the move is gone. Use it as a second opinion, not a signal to copy.
What you get from one screenshot
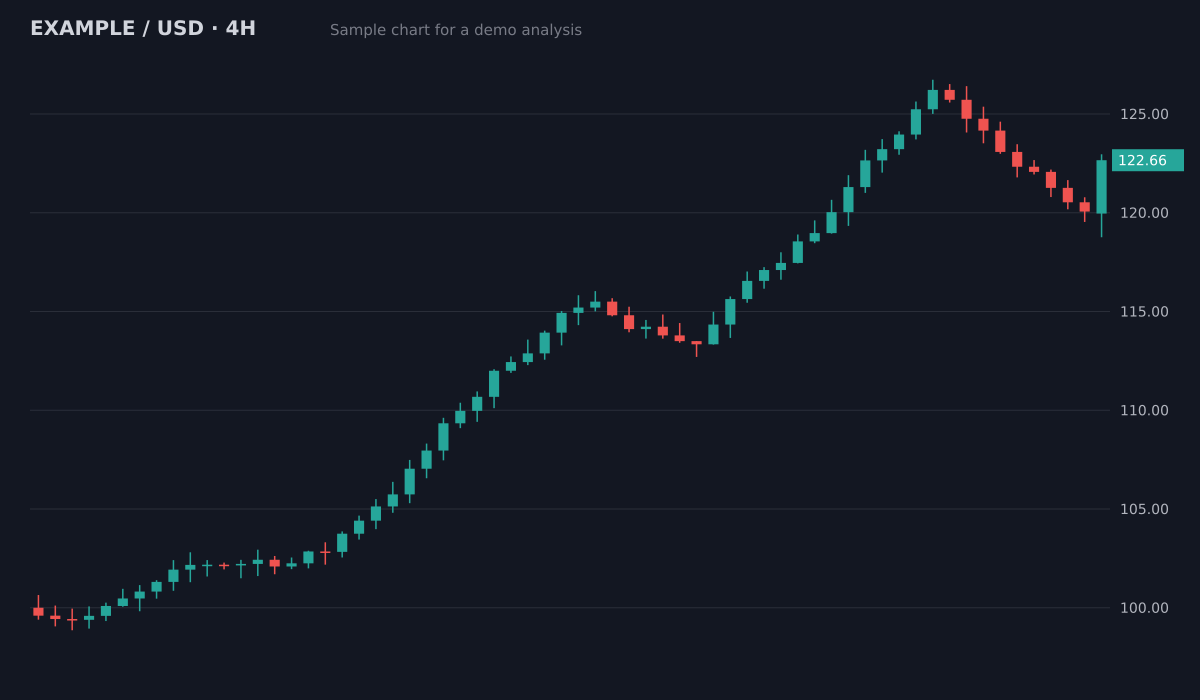
- Bias
- Bullish, pullback in an uptrend
- Structure
- Higher highs and higher lows since 100; pullback held above the 119.5 breakout area
- Key levels
- Resistance126.5 (swing high)
- Support119.5 to 120 (old breakout)
- Support113.5 to 115 (prior range)
- Plan
- Entry zone120.5 to 121.5
- Stop loss118.4
- Target 1126.5 (1:2.1)
- Target 2129.5 (1:3.3)
Invalid if a 4H candle closes below the 119.5 support. Size the position from the stop distance.
Sample chart with illustrative prices, not a live market. Educational, not financial advice.
Try it on your own chartScreenshot your intraday chart
A 5 minute, 15 minute or 1 hour chart from TradingView, MetaTrader or your exchange. Keep the candles, the price scale and the timeframe visible.
Upload it
From your computer or your phone browser. No account connection and no API key.
Get the plan
Bias, setup, entry zone, stop loss, targets and risk to reward, in plain language and in seconds.
Try it on your chart now
No account needed. Upload a screenshot and see the bias and key levels in seconds.
Check the higher timeframe too
Many losing day trades fight the bigger trend. Upload the 1 hour or 4 hour chart first to see the direction and the big levels, then the 5 or 15 minute chart for the entry. The multiple timeframes guide explains the method.
A stop outside the noise
Intraday charts are noisy, and a stop placed just past the last candle gets hit by normal moves. Every plan puts the stop where the setup is wrong, and the position size calculator turns that distance into a size for your account.
Same structure on every chart
Trend, levels, entry, stop, targets and ratio in the same order every time, so you can compare setups during the session and review them later in your trade journal.
Questions
Which timeframes work for day trading?
Any timeframe you can screenshot. Most day traders use the 5 minute or 15 minute chart for entries and the 1 hour chart for direction. Very short charts, like 1 minute, carry more noise, so levels from a higher timeframe matter even more.
Does it work for scalping?
It reads a 1 minute chart the same way, but scalps move faster than any manual check. It is most useful to plan the levels before the session or to review trades afterwards.
Can AI predict intraday moves?
No. It reads structure, levels and patterns from the picture. It cannot see the news, the spread or the order book. Educational analysis, not financial advice.
Is there a free trial?
Yes. Your first 3 analyses are free with no card required. Then it is $20 per month, cancel anytime.
Try it on your next chart
Upload a screenshot and get a full trade plan in seconds.
3 free analyses. No card required.
Plan your intraday levels before the move
Try free