Price pushes above a resistance level that held for days. You buy, because this is the breakout everyone was waiting for. An hour later, price is back inside the range and your stop is hit. That was a fakeout, and it is one of the most common ways traders lose money on a setup that looked obvious.
You cannot avoid every fakeout. Nobody can. But you can stop buying the first poke above a level, and you can build a plan where a fakeout costs you a small, planned loss instead of a big one. This guide shows how.
Breakout and fakeout, defined
A breakout is price closing clearly beyond a support or resistance zone and staying there. The level that used to cap price now becomes a floor (or the reverse for a breakdown).
A fakeout (also called a false breakout) is a move that pokes beyond the level and then falls back inside it. The traders who bought the push are now trapped, and their stop losses often fuel a move in the other direction.
The difference is rarely visible on the first candle. It shows up in what price does next: does it close beyond the level, does it hold there, and does a retest of the level hold?
Why fakeouts happen
- Stops sit just beyond obvious levels. Short sellers put their stops above resistance. When price pokes through, those stops trigger and add buying for a moment. Once they are filled, there may be no one left to buy.
- Many traders enter on the touch. Buy orders placed right at the level get filled on the first poke, then turn into sell orders when price falls back.
- Low participation. A move through a level on thin trading, outside the main session or right before a news release, is easier to reverse.
- No trend behind it. A breakout against the bigger trend, or from a messy range, has less fuel than one in the direction of the higher timeframe. See how to use multiple timeframes.
How to tell a real breakout from a fakeout
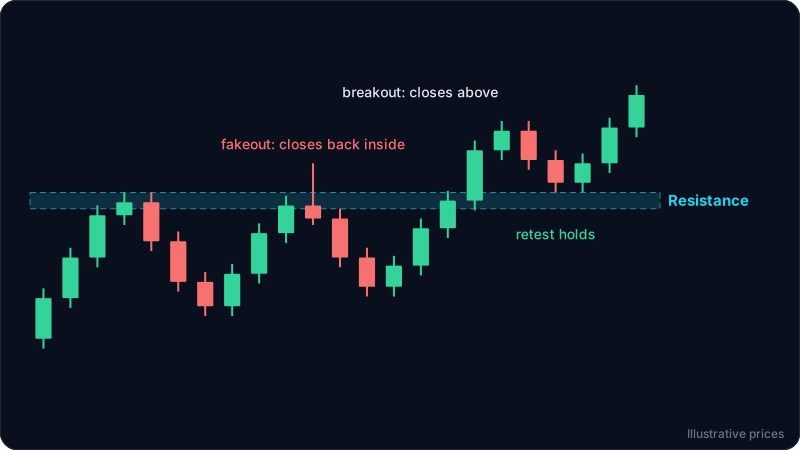
No single sign is proof. Look for several of these together:
- A close, not a wick. A wick above resistance is a test. A candle that closes clearly above the whole zone is a breakout candidate. Use the timeframe you trade: a 4 hour close for a 4 hour setup.
- Distance beyond the zone. A close a few ticks above the level is weak. A close well above the zone, with a strong body and a small upper wick, shows buyers stayed in control until the end of the candle.
- Follow-through. The next candle or two should not fall straight back inside. A real breakout usually keeps going or pauses above the level.
- The retest holds. Price often comes back to the broken level. If the old resistance now acts as support and price turns up from it, the breakout is much more credible. This is the role reversal from the support and resistance guide.
- Volume, when you have it. On stocks and many crypto charts, a breakout on rising volume is more convincing than one on falling volume. On spot forex, volume is not centralized, so lean on the close and the retest instead.
- Context. A breakout in the direction of the higher timeframe trend, from a tight range after several tests of the level, has the best odds. A breakout from the middle of nowhere does not.
The 4-step breakout plan
- Mark the zone, not a line. Use the wicks and bodies of the last tests to draw a zone. Levels are areas.
- Wait for the close. No entry while the candle is still open. If it closes back inside, there is no breakout, and you have lost nothing.
- Choose your entry style. Either enter on the breakout close (more trades, more fakeouts), or wait for the retest and a bullish candle off the zone (fewer trades, better location, but some breakouts never come back and you miss them). Pick one and use it consistently.
- Stop back inside the range, size from the stop. If price closes back inside the zone, the breakout idea is wrong. Put the stop below the zone with a buffer, then size the position from that distance. See how to set a stop loss.
The breakdown version is the mirror: support breaks with a close below the zone, the retest from below fails, the stop goes above the zone.
Worked example
These numbers are illustrative and not tied to any live market. They match the diagram above.
An asset on the 1 hour chart ranges between about 112.4 and 120 for two days. Resistance is the 119 to 120 zone, tested twice.
The fakeout. On the third test, a candle spikes to 121.8 but closes at 118.4, back inside the zone. A trader who bought the spike at 121 is already losing 2.6 per unit, and price drops to about 113.6 before turning. This is the trade the close rule avoids: no close above the zone, no entry.
The breakout. Two days later, a candle closes at 122.6, well above the zone, with a strong body. The next candle closes higher at 123.8. Price then pulls back, wicks down to 120.0 at the top of the old resistance, and the next candle closes at 121.8, back up and away from the zone.
- Entry: about 121.8, on the close that confirms the retest held.
- Stop: below the zone with a buffer, at 118.6. If price closes back under 119, the breakout has failed. Risk is 3.2 per unit.
- Target: the height of the range added to the breakout level. The range was about 7.6 tall (120 - 112.4), so the measured target is about 127.6. Reward 5.8, about 1 to 1.8.
The risk reward calculator checks that ratio, and the position size calculator turns the 3.2 stop distance into a size for your account. If 1 to 1.8 is below your minimum, skip the trade or wait for a deeper retest.
Common mistakes
- Buying the first poke. The wick above the level is where fakeouts trap people. Wait for the close.
- Stop just above the level. A stop at 120.1 on a breakout of 120 gets taken by normal noise during the retest. Put it back inside the range, where the idea is truly wrong.
- Chasing a breakout that already ran. If price is already far above the level when you see it, your stop is far away and the ratio is poor. Wait for a retest or skip it.
- Trading every level. A range that has been touched once is not a level worth breaking. Two or three clean tests make it meaningful.
- Ignoring news. Breakouts right before a major release often reverse when the number comes out. Check the calendar first.
FAQ
How do you confirm a breakout?
Most traders want a candle close beyond the zone on the timeframe they trade, follow-through on the next candles, and ideally a retest of the broken level that holds. Rising volume adds confidence on markets where volume is reliable.
Should you enter on the breakout or on the retest?
Both work if you are consistent. The breakout entry catches every move but suffers more fakeouts. The retest entry gives a tighter stop and a better ratio but misses breakouts that never come back. Many traders split it: half on the close, half on the retest.
What happens to my stop on a fakeout?
If you entered on a close and placed the stop back inside the range, a fakeout means a small, planned loss. The damage comes from entering on the wick with no stop, or with a stop so tight it was never going to survive the retest.
Can a fakeout be a trade in the other direction?
Yes. When price pokes above resistance and closes back inside, the trapped buyers often have to sell. Some traders short the failed breakout with a stop above the fakeout wick. It is the same logic in reverse: a defined level, a close, and a stop where the idea is wrong.
Does this work on crypto, forex and stocks?
The close rule and the retest work on any chart. Crypto trades all week, so weekend breakouts on thin trading fail more often. Forex has no central volume, so the close and retest matter more there. On stocks, volume is a useful extra check.
Try it on your own chart
ChartEdge AI reads a chart screenshot and gives you the trend, the key support and resistance zones, and a plan with entry, stop and targets. Use it to check whether a breakout on your chart has closed beyond a real level before you act. Try it with 3 free analyses, no card required. Educational only, not financial advice.