Look at a daily chart and the market is going up. Switch to the 5 minute chart and it is falling hard. Which one is right? Both are, and that is exactly why traders use more than one timeframe.
Multiple timeframe analysis means reading the same market on two or three chart periods, each with its own job. Done well, it keeps you trading with the bigger flow while still getting a precise entry and a tight, logical stop. Done badly, it becomes a way to find a reason for any trade you already wanted to take.
This guide gives you a simple top-down routine you can run on any chart screenshot.
Why one timeframe is not enough
A single timeframe forces a trade-off:
- Only a high timeframe (daily, 4 hour) shows the real trend and the levels that matter, but entries are coarse and stops are wide, so positions must be small.
- Only a low timeframe (15 minute, 5 minute) gives precise entries, but every small swing looks like a trend, and you end up buying straight into a daily resistance you never saw.
Combining them gives you the direction and the levels from the higher one, and the timing from the lower one.
Pick a pair of timeframes
A common rule of thumb is to keep a ratio of about 4 to 6 between them. Some pairs that work:
| You hold trades for | Higher timeframe (direction) | Lower timeframe (entry) |
|---|---|---|
| Weeks | Weekly | Daily |
| A few days | Daily | 4 hour or 1 hour |
| Hours | 4 hour | 15 minute |
| Minutes | 1 hour | 5 minute |
Two timeframes are enough for most people. A third, even higher one can help you spot the very big levels, but more than three usually adds confusion, not information.
The 3-step top-down routine
Step 1: Higher timeframe, direction
Start on the higher chart and answer one question: is it trending up, trending down or ranging? Use the swing highs and lows, as in trend vs range markets. Write the answer down before you look at anything else.
- Uptrend: you only look for longs.
- Downtrend: you only look for shorts.
- Range: you only look at the edges of the range.
Step 2: Higher timeframe, the area
Still on the higher chart, mark where you would be interested: a former resistance turned support in an uptrend, the last higher low, or the edge of a range. If you need a refresher on drawing these, see support and resistance for beginners.
If price is nowhere near such an area, you are done for now. Set an alert and wait. Most of the value of this routine is in the trades it stops you from taking in the middle of nowhere.
Step 3: Lower timeframe, the trigger
Only when price reaches your higher timeframe area, switch down. On the lower chart you look for the sign that the move into the area is ending, in the direction of the higher trend:
- In an uptrend pulling back to support: the lower timeframe stops making lower lows, makes a higher low, and breaks above its last lower high.
- In a downtrend rallying into resistance: the mirror image.
That break on the lower timeframe is your trigger. The entry is now precise and the stop has an obvious place: beyond the lower timeframe swing that formed in the area.
Worked example
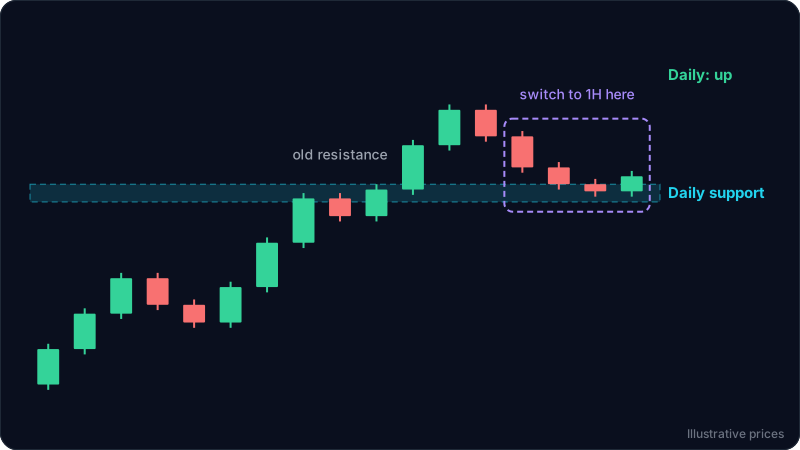
These numbers are illustrative and not tied to any live market.
- Daily, direction. A coin makes higher highs and higher lows. Daily answer: uptrend, longs only.
- Daily, area. The old resistance around 120.6 to 122.6 broke and price pulls back toward it. That zone is the area of interest. Price is at 124, close to it.
- 1 hour, trigger. On the 1 hour chart, the pullback slows inside the zone. It makes a low at 121.2, a lower high at 123.0, then a higher low at 121.9, then a candle closes above 123.0. That is the trigger.
The plan:
- Entry: about 123.1, after the close above the 1 hour lower high.
- Stop: below the 1 hour higher low and the daily zone with a small buffer, around 120.4. A move there means the daily support failed. See how to set a stop loss.
- Target: the last daily high near 131.6.
Risk is 2.7 and reward is 8.5, about 1 to 3.1. On the daily chart alone, the natural stop would have been under the last daily higher low, around 106, and the same target would have offered well under 1 to 1.
Common mistakes
- Timeframe shopping. Looking at five timeframes until one agrees with the trade you want. Decide the pair before you open the chart.
- Letting the lower timeframe overrule the higher one. A strong 5 minute drop inside a daily uptrend is a pullback until the daily structure breaks.
- Entering before price reaches the area. The lower timeframe trigger only counts inside the higher timeframe zone.
- Using a lower timeframe stop with a higher timeframe target and too much size. A tight stop is fine, but size it with the position size calculator so a loss is still your normal 1 percent.
- Gaps too small between timeframes. A 15 minute and a 5 minute chart show almost the same thing. Keep the ratio around 4 to 6.
FAQ
What is the best timeframe combination?
There is no single best one. Pick the higher timeframe from how long you hold trades, then divide by about 4 to 6 for the entry timeframe: daily with 4 hour or 1 hour for swing trades, 1 hour with 5 minute for intraday trades.
What if the timeframes disagree?
They often will. The higher timeframe sets the direction; the lower one only times the entry. If the lower chart moves against the higher trend, treat it as a pullback and wait for it to reach your area and turn. If the higher timeframe itself is unclear, skip the trade.
How many timeframes should I use?
Two for most traders: one for direction and levels, one for the entry. A third, higher one is optional for spotting the biggest levels.
Does multiple timeframe analysis work for forex, crypto and stocks?
Yes. The method only uses price structure and levels, so it works the same on any market that has a chart.
Where does the stop go when I enter on the lower timeframe?
Beyond the lower timeframe swing that formed inside the higher timeframe area, with a buffer. If that level is also beyond the higher timeframe zone, even better: a break there means the bigger idea is wrong too.
Try it on your own chart
ChartEdge AI reads a chart screenshot and gives you the trend, the key levels and a plan with entry, stop and targets. Upload your higher timeframe chart for the direction and the area, then your lower timeframe chart when price gets there, and compare the two reads. Try it with 3 free analyses, no card required. Educational only, not financial advice.