Most losing trades are not bad entries. They are good setups used in the wrong kind of market: a breakout bought in the middle of a sideways range, or a "top" shorted in the middle of a strong uptrend.
Before you look for an entry, answer one question: is this market trending or ranging right now? This guide shows you how to answer it in under a minute on any chart screenshot, which setups fit each condition, and how to notice when one turns into the other.
What a trend looks like
A trend is a market that keeps making progress in one direction.
- Uptrend: higher highs and higher lows. Each rally goes further than the last one, and each pullback stops above the previous pullback.
- Downtrend: lower highs and lower lows. Each drop goes further, and each bounce fails below the previous bounce.
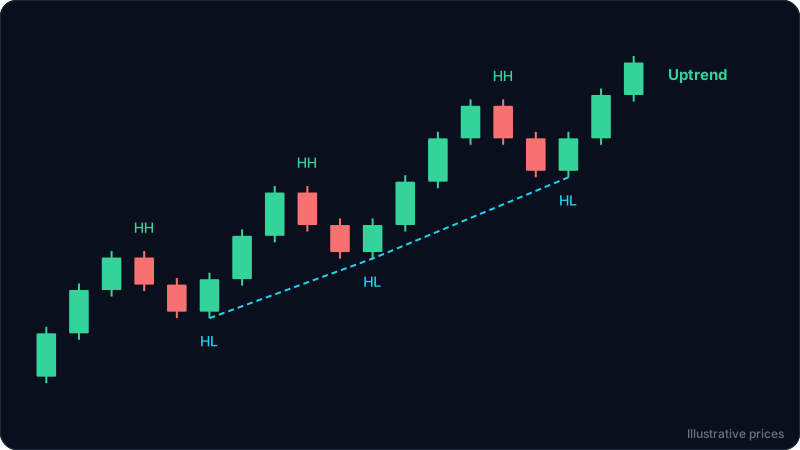
The key detail is the lows in an uptrend (and the highs in a downtrend). Anyone can see that price went up. What tells you the trend is still alive is that buyers keep stepping in at higher prices on every dip. The dashed line in the diagram connects those higher lows.
What a range looks like
A range is a market that moves but makes no progress. Price bounces between a ceiling (resistance) and a floor (support), and neither side manages to push through.
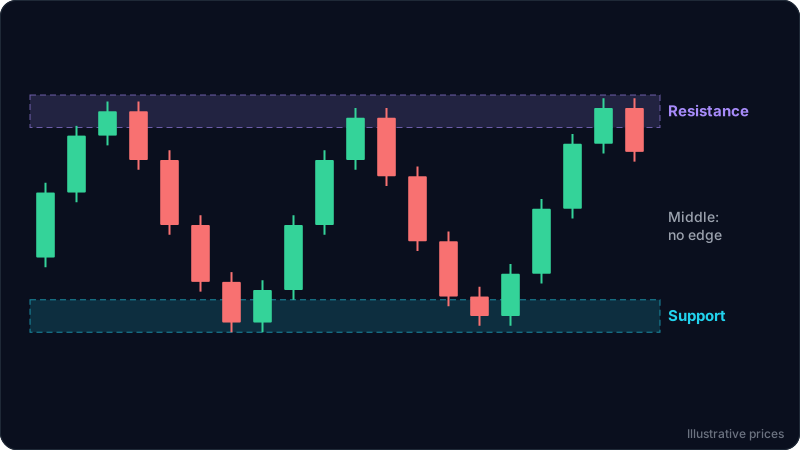
In a range, highs are roughly equal and lows are roughly equal. Each rally runs out of steam near the same area, and each drop finds buyers near the same area. If you need a refresher on drawing those zones, read support and resistance for beginners.
The middle of a range is where most traders lose money: there is no nearby level to define risk, and price can go either way.
The 4-question checklist
Run these on the timeframe you plan to trade. They take less than a minute.
- Are the last two swing highs and the last two swing lows both rising, both falling, or flat? Both rising: uptrend. Both falling: downtrend. Flat or mixed: range or transition.
- Is price mostly above or below a 50 period moving average, and is the average sloping? A sloped average that price respects points to a trend. A flat average that price crosses back and forth points to a range.
- How do pullbacks behave? In a trend, pullbacks are short and shallow compared with the moves in the trend's direction. In a range, moves up and down are about the same size.
- Can you draw a clear ceiling and floor that price touched at least twice each? If yes, and question 1 says flat, you are in a range.
If the answers disagree, treat the market as unclear. Unclear is a valid answer, and often the best trade is no trade.
Worked example 1: a trend
These numbers are illustrative and not tied to any live market.
On a 4 hour chart, a coin makes swing highs at 113, 119 and 127, and swing lows at 108, 113.5 and 121. Every high is higher, every low is higher. Price sits above a rising 50 period average.
Answer: uptrend. The trend trader's question is not "is it too high?" but "where is the next pullback likely to hold?" A plan could be:
- Wait for a pullback toward the last higher low area (around 121) or a former resistance turned support.
- Enter when a candle shows buyers stepping back in, for example a close back above the prior candle's high.
- Stop below the last higher low, with a buffer, because a break of that low means the structure is no longer higher lows. See how to set a stop loss.
- Target the previous high first, then trail the rest.
Worked example 2: a range
On a 1 hour chart, a forex pair has topped three times between 1.0880 and 1.0900, and bottomed three times between 1.0754 and 1.0774. The 50 period average is flat and price crosses it constantly.
Answer: range. The range trader's plan:
- Do nothing in the middle (around 1.0830). There is no level to lean on.
- Look for longs only near the floor, with a stop just below the support zone.
- Look for shorts only near the ceiling, with a stop just above resistance.
- Target the opposite side of the range, or the middle if the range is narrow.
Check the reward against the risk before you commit: in a tight range the trip from floor to ceiling may not pay enough. The risk reward guide shows how to measure it.
Which setups fit which market
| Market | Setups that tend to fit | Setups that tend to fail |
|---|---|---|
| Uptrend | Buy pullbacks to support, breakouts to new highs, trail stops | Picking tops, shorting because it "went up too much" |
| Downtrend | Short rallies into resistance, breakdowns to new lows | Catching bottoms, buying because it "is cheap now" |
| Range | Buy the floor, sell the ceiling, target the other side | Buying breakouts at the ceiling, chasing moves in the middle |
None of these work every time. The table is about which way the odds lean, not about certainty.
How a trend turns into a range (and back)
Markets switch condition all the time. The signs are usually visible on the chart before most traders react.
A trend is weakening when:
- A pullback breaks below the previous higher low (in an uptrend). That is the first lower low.
- A rally fails to make a new high and stalls at or under the last one.
- The moving average flattens and price starts crossing it.
A range is ending when:
- Price closes clearly outside the zone, not just with a wick.
- The broken level holds on a retest from the other side (old resistance acting as support).
- The next swing makes a new high or low beyond the range.
A single candle poking outside a range is often a fakeout. Wait for a close, and ideally a retest, before you treat it as a new trend.
Timeframes change the answer
The same market can be trending on the daily chart and ranging on the 15 minute chart. Neither is wrong. Decide which timeframe you trade, run the checklist there, then glance at one timeframe higher to know which direction the bigger flow is pushing. A long setup in a range that sits inside a daily uptrend has the wind at its back.
Common mistakes
- Calling every move a trend. Two green candles are not a trend. You need at least two higher highs and two higher lows.
- Trading breakouts inside a range. Most pushes into the ceiling of a range get sold. Wait for the close and the retest.
- Fighting a strong trend. "It has to come down" is not a reason to short. Wait for the structure to break first.
- Ignoring the unclear state. When the checklist gives mixed answers, sitting out is a decision, not a missed trade.
- Changing timeframes to find the answer you want. Pick the timeframe before you look, not after.
FAQ
How do I know if a market is trending or ranging?
Look at the last two swing highs and lows. Both rising is an uptrend, both falling is a downtrend, flat or mixed is a range or a transition. A sloping 50 period moving average that price respects supports the trend reading; a flat one that price keeps crossing supports the range reading.
Is it better to trade trends or ranges?
Neither is better in general. Trends offer bigger moves but entries feel uncomfortable because price already moved. Ranges offer clear levels and tight stops but smaller targets and frequent fakeouts at the edges. Pick the setup that fits the market in front of you.
What indicator shows trend vs range?
Price structure (highs and lows) comes first. A moving average helps confirm it. Some traders also use ADX: readings above about 25 are often read as trending and below about 20 as ranging, but treat it as a hint, not a rule.
How long does a range last?
There is no fixed length. Ranges can last hours on small timeframes or months on weekly charts. What matters is whether the ceiling and floor still hold, not how long they have existed.
What should I do when I cannot tell?
Stay out, or wait for price to reach a clear level such as the edge of the range or a well-tested support. Unclear markets produce most of the random losses beginners take.
Try it on your own chart
ChartEdge AI reads a chart screenshot and tells you the trend, the market structure and the key levels, then builds a plan with entry, stop and targets that fits the condition it sees. Upload a chart and compare its read with your own checklist. Try it with 3 free analyses, no card required. Educational only, not financial advice.