The risk to reward ratio compares how much you can lose on a trade with how much you can make. It is one of the first numbers to check before entering, and one of the most misunderstood.
This guide shows how to calculate it, how it works together with your win rate, and why a "1 to 5" trade is not automatically a good trade.
What the ratio measures
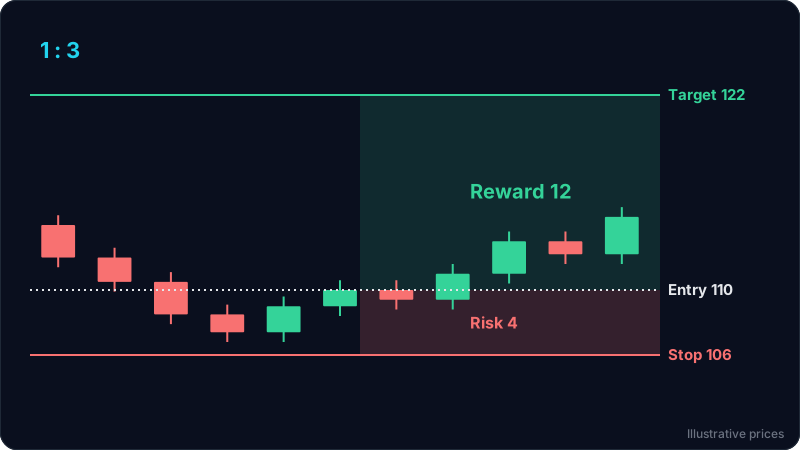
Every planned trade has three prices:
- Entry: where you get in.
- Stop loss: where you accept the idea is wrong and exit.
- Target: where you plan to take profit.
Risk is the distance from entry to stop. Reward is the distance from entry to target. The ratio is reward divided by risk.
Risk to reward = (target - entry) / (entry - stop) for a long trade.
For a short trade, flip the subtraction: (entry - target) / (stop - entry).
A result of 2 means you aim to make two units for every one unit you risk. Traders write this as 1:2, "1 to 2" or "2R".
A quick calculation
You plan to buy at 100, with a stop at 98 and a target at 106.
- Risk: 100 - 98 = 2
- Reward: 106 - 100 = 6
- Ratio: 6 / 2 = 3, so 1:3
If you had used a target of 101, the ratio would be 1 / 2 = 0.5. You would be risking twice what you hope to make.
You can check any plan instantly with the free risk reward calculator.
Thinking in R
Many traders measure results in R, where 1R is the amount risked on a trade. If you risk $50 and make $150, that is +3R. If you lose the full $50, that is -1R.
Measuring in R has two benefits:
- Results stay comparable when your account size changes.
- It forces you to know your risk before you enter, which means you already have a stop. If you do not have one yet, read how to set a stop loss first.
The ratio means nothing without win rate
A high ratio is easy to get: put the target very far away. The catch is that far targets are reached less often. What matters is the combination of ratio and how often the trade works. Our guide on what a good win rate is works through expectancy and costs.
Break-even win rate = 1 / (1 + ratio)
| Ratio | Win rate needed to break even (before costs) |
|---|---|
| 1:1 | 50 percent |
| 1:1.5 | 40 percent |
| 1:2 | about 33 percent |
| 1:3 | 25 percent |
| 1:4 | 20 percent |
These are arithmetic, not promises. They show that a strategy can win less than half the time and still be sound if the winners are larger than the losers. They also show that a 1:4 trade with a 15 percent chance of reaching the target loses money over time.
Fees, spreads and slippage raise the real break-even point, so leave some margin.
Where the target should come from
The target should come from the chart, not from the ratio you wish you had. Good places to aim for:
- The next clear resistance zone for a long, or support zone for a short. See support and resistance for beginners.
- A recent swing high or low where price turned before.
- A measured move, such as the height of a range projected from the breakout point.
Then check: does the ratio between the structural stop and the structural target make the trade worth it? If not, the honest answer is to skip the trade or wait for a better entry, not to move the target further away.
Improving the ratio the right way
There are only three levers, and two of them are dangerous.
- Better entry (good). Waiting for price to come closer to your support zone shrinks the risk while the target stays the same. A limit order at the zone instead of chasing a green candle often turns a 1:1.5 trade into a 1:3 trade.
- Tighter stop (risky). Moving the stop closer improves the number on paper, but if it now sits inside normal noise you will be stopped out more often, which lowers your win rate.
- Further target (risky). Pushing the target past the next obstacle improves the ratio but reduces the chance of getting there.
Worked example
The numbers below are illustrative and not tied to any live market.
- Account: $2,000. Risk per trade: 1 percent, so $20.
- A market pulls back to a support zone between 24.80 and 25.00.
- The last swing low is 24.70. With a small buffer, the stop goes at 24.55.
- The next resistance zone starts at 26.40.
Option A: buy now at 25.60. Risk: 25.60 - 24.55 = 1.05. Reward to 26.40: 0.80. Ratio: 0.80 / 1.05 = about 0.76. Not worth it.
Option B: wait for a limit buy at 25.05, inside the top of the support zone. Risk: 25.05 - 24.55 = 0.50. Reward: 26.40 - 25.05 = 1.35. Ratio: 1.35 / 0.50 = 2.7.
Position size for option B: $20 / 0.50 = 40 units. If stopped out, you lose about $20 (plus costs). If the target is reached, you make about $54, or +2.7R.
Same market, same stop logic, same target. Only the entry changed, and the trade went from poor to reasonable. The trade-off is that the limit order might never fill, and that is fine: a missed trade costs nothing.
This is an educational example, not financial advice or a trade recommendation.
Common mistakes
- Choosing the target to fit a ratio. "I need 1:3, so the target goes here" ignores what the chart says.
- Ignoring the win rate. A strategy of 1:5 trades that almost never reach target is a losing strategy.
- Moving the stop after entry. The ratio you planned is only real if you keep the stop where it was.
- Forgetting costs. On small timeframes, spreads and fees can take a large share of a small reward.
- Taking partial profits without counting them. If you scale out, your real average reward is smaller than the final target suggests. Track it in R.
Risk to reward checklist
- Is the stop at the price that invalidates the idea?
- Is the target at a real level on the chart?
- What is the ratio, and what win rate does it need to break even?
- Is your historical win rate for this setup comfortably above that?
- Can a better entry improve the ratio without changing the stop logic?
FAQ
What is a good risk to reward ratio?
Many traders look for at least 1:2 because it breaks even with a win rate around 33 percent before costs. There is no universal answer: a setup that wins often can work at 1:1, while a low win rate setup needs a higher ratio.
Is a higher risk to reward ratio always better?
No. A higher ratio usually means a target that is reached less often. What matters is the ratio and the win rate together, which you can only learn by tracking your own trades.
How do I calculate risk to reward for a short trade?
Risk is the stop minus the entry, and reward is the entry minus the target. Divide reward by risk. For example, a short at 50 with a stop at 52 and a target at 44 has a risk of 2, a reward of 6, and a ratio of 1:3.
Does risk to reward include fees?
The basic formula does not. Fees, spreads and slippage reduce the reward and increase the loss, so the real ratio is a little worse than the one on the chart. It matters most on short timeframes with small targets.
Try it on your own chart
ChartEdge AI reads your chart screenshot and returns an entry, stop loss, targets and the risk to reward for each target, so you can see at a glance whether a setup is worth taking. Try it with 3 free analyses, no card required.