Free AI chart analyzer
Upload a chart screenshot and see what the AI reads, for free. The demo below needs no account. A free account adds 3 full analyses with entry, stop loss and targets, no card required.
What you get from one screenshot
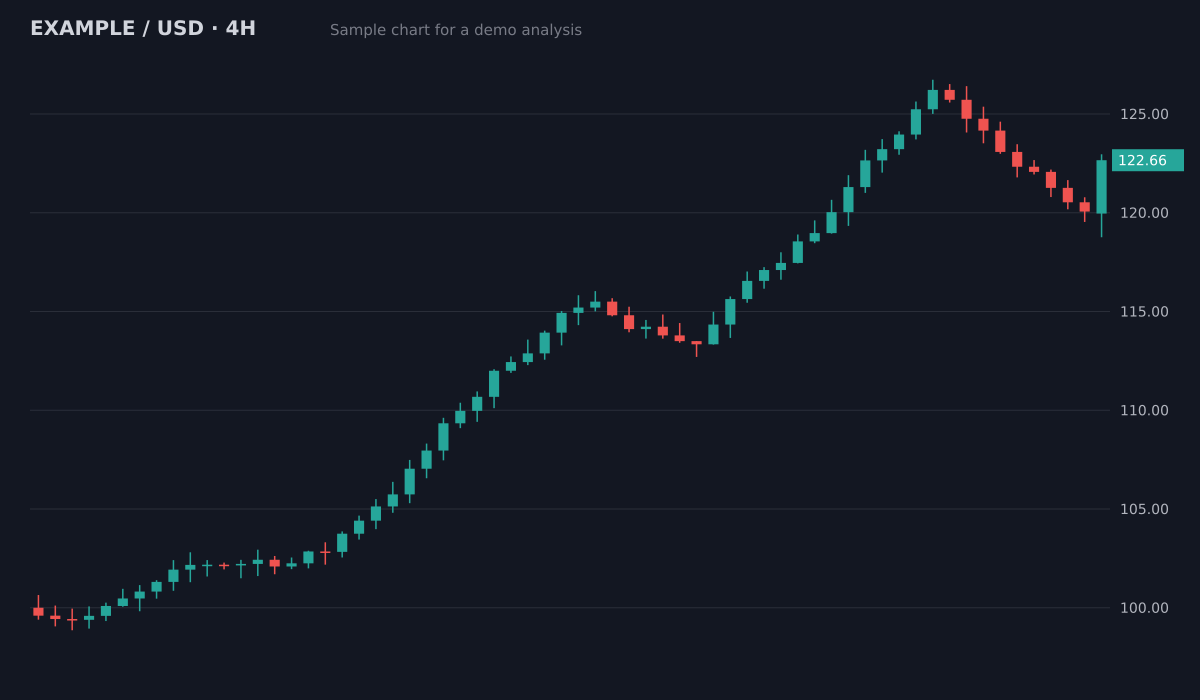
- Bias
- Bullish, pullback in an uptrend
- Structure
- Higher highs and higher lows since 100; pullback held above the 119.5 breakout area
- Key levels
- Resistance126.5 (swing high)
- Support119.5 to 120 (old breakout)
- Support113.5 to 115 (prior range)
- Plan
- Entry zone120.5 to 121.5
- Stop loss118.4
- Target 1126.5 (1:2.1)
- Target 2129.5 (1:3.3)
Invalid if a 4H candle closes below the 119.5 support. Size the position from the stop distance.
Sample chart with illustrative prices, not a live market. Educational, not financial advice.
Try it on your own chartTry the demo, no account
Upload a chart below and get the bias, trend and key levels. Up to 2 demo reads a day.
Sign up free for the full plan
3 complete analyses with entry, stop loss, targets and risk to reward. No card, no broker connection.
Keep the free tools
The guides, the glossary and the position size, risk reward and pip value calculators stay free with no account.
Try it on your chart now
No account needed. Upload a screenshot and see the bias and key levels in seconds.
What is free, exactly
The demo (bias, trend and key levels, no account), 3 full analyses on a free account, every guide and every calculator. Nothing asks for a card until you choose Pro.
What Pro adds
Unlimited analyses, every report saved to your dashboard, the trade journal and the built-in position sizer, for $20 a month or $180 a year. Cancel anytime.
Free chatbot or a chart tool?
A general chatbot can describe a chart image if you ask the right questions. ChartEdge AI is built only for charts: every analysis returns the same structured plan, with an invalidation level and levels you can check on your own chart.
Learn and plan for free
- Guide: How AI Chart Analysis Works
- Guide: How to Read a Trading Chart for Beginners
- Guide: ChatGPT vs a Dedicated AI Chart Tool
- Guide: How to Use AI for Trading Safely
- Free ChatGPT prompt for chart analysis
- Free position size calculator
- Free risk reward calculator
- AI chart analysis tools 2026: prices and free plans
Questions
Is there a free AI chart analyzer with no sign up?
Yes. The demo on this page reads the bias, trend and key levels of your chart with no account. The full plan with entry, stop loss and targets needs a free account.
Do I need a credit card for the free analyses?
No. The 3 free analyses need only an email address. A card is asked only if you choose Pro.
What happens after the 3 free analyses?
Your reports stay in your account. You can upgrade to Pro for unlimited analyses, or invite a friend: each friend who signs up and runs a first analysis gives you 3 more free analyses.
Is a free AI analysis good enough to trade on?
No analysis, free or paid, can predict price. Use it as a second opinion, check the levels yourself and size every trade from the stop. ChartEdge AI is educational, not financial advice.
What does the free analysis include?
The full report, the same as Pro: bias, trend, key levels, an entry zone, a stop loss, targets and the risk to reward. The 3 free analyses are not a cut-down version, they are just limited in number.
Does the free analyzer work with phone screenshots?
Yes. A screenshot from a broker or exchange app on your phone works as long as the candles and the price scale are visible. Crop out notifications and keep the timeframe in view.
How do I analyse a trading chart with AI for free?
Take a screenshot with the candles, price scale and timeframe visible. Upload it to the demo on this page for the bias and key levels, or create a free account for 3 full plans with entry, stop loss and targets.
Can I use ChatGPT to analyse charts for free?
ChatGPT can describe a chart image, and a structured prompt helps. ChartEdge AI returns the same plan format every time, with a stop on every idea and a saved history. The guide ChatGPT vs a dedicated AI chart tool compares both.
Which markets does the free analyzer read?
Crypto, forex, gold and other metals, indices and stocks, on any timeframe, from TradingView, MetaTrader, exchange or broker app screenshots.
Does the free analyzer read OTC charts?
Yes. It reads the candles on any chart screenshot, OTC included. OTC prices come from the broker's own feed, so the report says to read the levels as zones, not exact prices.
Does the free analysis tell me the lot size?
Yes, on gold, silver and pairs quoted in USD. Every report with a trade plan, free ones included, has a position sizer: with your balance and risk percent it shows the lot size rounded down to 0.01 and the contract size it assumed. Check that in your own platform.
Does it work on 1 and 5 minute gold charts?
Yes. It reads XAU/USD on any timeframe. On 1 to 15 minute charts the report reads the levels as zones, reminds you to check the 1 hour direction and links the step by step routine for fast gold charts. Educational analysis, not financial advice.
Try it on your next chart
Upload a screenshot and get a full trade plan in seconds.
3 free analyses. No card required.
Try the free demo on your chart
Try free