AI technical analysis of any chart
Technical analysis means reading what price has done: the trend, the levels where it turned, the patterns it formed and what indicators on the chart say. ChartEdge AI does that read from a single screenshot and turns it into a plan with entry, stop loss and targets, so you can compare it with your own view in seconds.
What you get from one screenshot
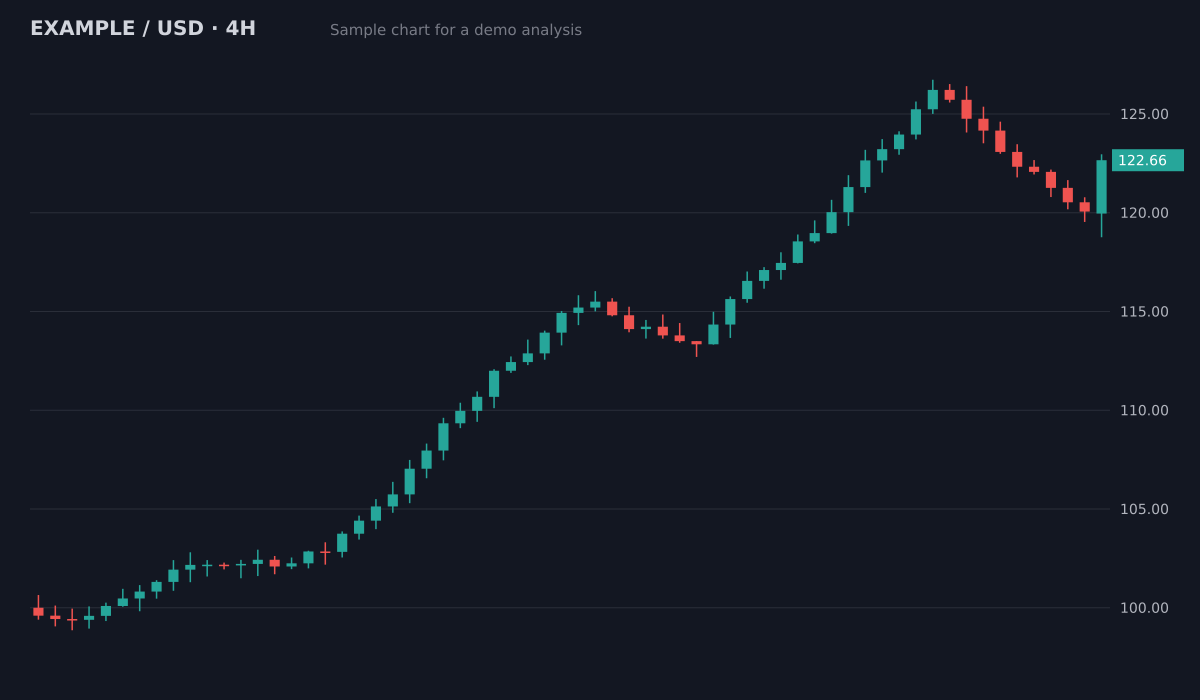
- Bias
- Bullish, pullback in an uptrend
- Structure
- Higher highs and higher lows since 100; pullback held above the 119.5 breakout area
- Key levels
- Resistance126.5 (swing high)
- Support119.5 to 120 (old breakout)
- Support113.5 to 115 (prior range)
- Plan
- Entry zone120.5 to 121.5
- Stop loss118.4
- Target 1126.5 (1:2.1)
- Target 2129.5 (1:3.3)
Invalid if a 4H candle closes below the 119.5 support. Size the position from the stop distance.
Sample chart with illustrative prices, not a live market. Educational, not financial advice.
Try it on your own chartScreenshot your chart
Any market and any timeframe. Indicators you already use, like RSI, MACD or moving averages, can stay on the chart.
Upload it
Drop the image in from your computer or phone. Nothing to install and no account to connect.
Read the analysis
Trend, structure, key levels, patterns, what the visible indicators show, and a trade plan with entry, stop loss and targets.
Try it on your chart now
No account needed. Upload a screenshot and see the bias and key levels in seconds.
What it reads on the chart
Higher highs and lower lows for the trend, the zones where price reacted more than once for support and resistance, classic patterns such as flags, double tops or head and shoulders, and visible indicators like RSI, MACD and moving averages.
What it cannot see
A screenshot holds no news, no order book and no fundamentals. The analysis is technical only. That is why each report ends with levels that tell you when the idea is wrong, not a promise about where price goes.
Learn the method while you use it
Each report explains its reasoning in plain language. The free guides on support and resistance, candlestick patterns and multiple timeframes show the same method step by step.
Questions
Is AI technical analysis better than doing it myself?
It is faster and it is consistent: the same checks on every chart. It is best used as a second opinion next to your own read, not as a replacement for it.
Does it work with indicators on the chart?
Yes. If RSI, MACD, moving averages or volume are visible in the screenshot, the analysis takes them into account. A clean chart with candles and a price scale also works.
Which markets are supported?
Crypto, forex, gold and other commodities, indices and stocks, from any platform you can screenshot.
Is it financial advice?
No. It is educational technical analysis to support your own decisions, not financial advice. Trading involves risk. 3 free analyses, then $20 per month.
Try it on your next chart
Upload a screenshot and get a full trade plan in seconds.
3 free analyses. No card required.
Get a technical read of your own chart
Try free