Stock chart analysis with AI
Screenshot a stock chart from your broker or TradingView and get a structured read: trend, key levels, the setup in play, and a trade plan with entry, stop loss and targets.
What you get from one screenshot
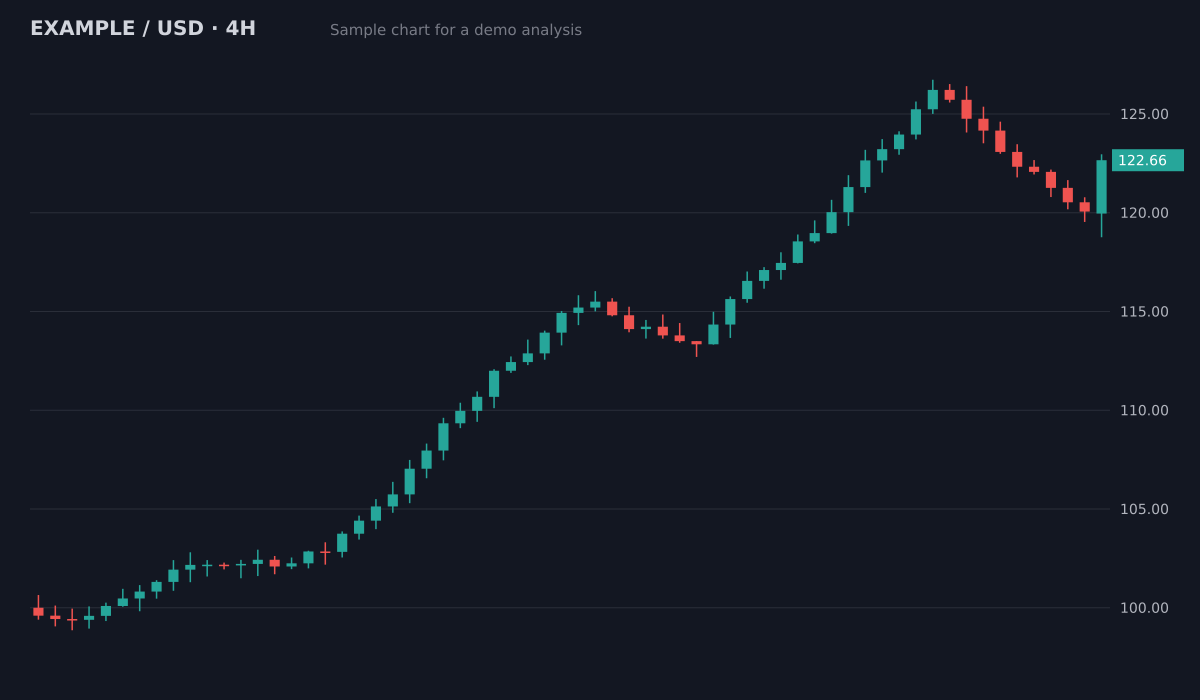
- Bias
- Bullish, pullback in an uptrend
- Structure
- Higher highs and higher lows since 100; pullback held above the 119.5 breakout area
- Key levels
- Resistance126.5 (swing high)
- Support119.5 to 120 (old breakout)
- Support113.5 to 115 (prior range)
- Plan
- Entry zone120.5 to 121.5
- Stop loss118.4
- Target 1126.5 (1:2.1)
- Target 2129.5 (1:3.3)
Invalid if a 4H candle closes below the 119.5 support. Size the position from the stop distance.
Sample chart with illustrative prices, not a live market. Educational, not financial advice.
Try it on your own chartScreenshot the ticker
Any stock or ETF, daily, weekly or intraday. Your broker, TradingView or any charting site.
Upload it
No brokerage connection and no API keys. The image is all it needs.
Get a plan
Bias, setup, entry, stop loss, targets and risk to reward, with the reasoning behind each level.
Try it on your chart now
No account needed. Upload a screenshot and see the bias and key levels in seconds.
Gaps change the risk
Stocks close overnight and can open far from the last price after earnings or news. A stop order cannot protect against a gap, so size positions with that in mind, especially around earnings dates.
Check the index too
Most stocks move with the broad market much of the time. Run the S&P 500 or Nasdaq chart as well before acting on a plan for a single stock.
Swing and position traders
Daily and weekly charts suit stocks well. The plan names the level that invalidates the setup, so you can hold through normal noise and still know where you are wrong.
Questions
Does it work for any stock?
Yes, any ticker and ETF on any exchange, as long as the candles and the price scale are visible on the screenshot.
Does it use earnings or fundamentals?
No. It reads the chart only. Check the earnings calendar and news yourself before acting on any plan.
Is it financial advice?
No. ChartEdge AI is an educational analysis tool. You make your own decisions and manage your own risk.
Try it on your next chart
Upload a screenshot and get a full trade plan in seconds.
3 free analyses. No card required.
Get a plan for your stock chart
Try free