Two lines on a chart, one fast and one slow. When the fast one crosses above the slow one, buy. When it crosses below, sell. The moving average crossover is probably the first strategy most traders ever test, and it is easy to see why: it is simple, visual and impossible to misread.
It is also easy to lose money with if you trade every cross. This guide explains what the crossover really tells you, when it works, when it fails, and a plan that uses it as a filter instead of a buy button.
What a moving average is
A moving average is the average closing price over the last N candles, recalculated on every new candle and drawn as a line.
- Simple moving average (SMA): every close in the window counts the same. A 20 period SMA on the daily chart is the average close of the last 20 days.
- Exponential moving average (EMA): recent closes count more, so it turns faster than an SMA of the same length. That also means it reacts more to noise.
Neither is better. EMAs suit traders who want earlier signals and accept more false ones; SMAs suit traders who prefer fewer, slower signals. Pick one and stay with it.
The crossover
A crossover strategy uses two averages:
- Fast average: a short window, for example 20 periods. It hugs price.
- Slow average: a longer window, for example 50 periods. It shows the broader direction.
Bullish crossover: the fast average crosses above the slow one. The last 20 closes are now higher on average than the last 50: the short term has turned up.
Bearish crossover: the fast average crosses below the slow one. The mirror image.
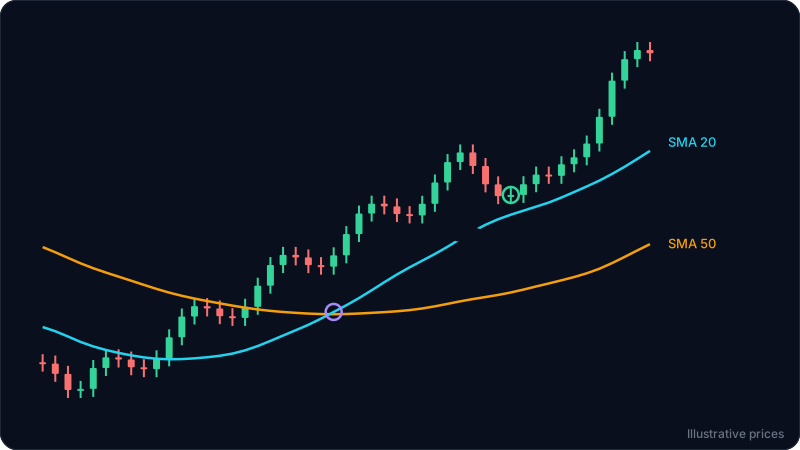
Look at where the cross sits in the diagram. Price bottomed and rallied for several candles before the 20 crossed the 50. That delay is built in: an average of the last 20 closes cannot turn until enough of those closes are higher. A crossover confirms a move that has already started. It never catches the low.
Golden cross and death cross
These are the same idea on longer averages, usually the 50 and the 200 on the daily chart.
- Golden cross: the 50 day average crosses above the 200 day. Often described as the start of a long term uptrend.
- Death cross: the 50 day crosses below the 200 day.
They get a lot of attention because they are rare and easy to spot. They are also very late: by the time a 50 day average crosses a 200 day average, price has usually moved a long way. Treat them as a description of the long term trend, not as an entry.
Why crossovers whipsaw in ranges
In a sideways market the two averages flatten and run close together. Price swings above and below both, and the lines cross back and forth. Every cross looks like a new signal and each one is reversed a few candles later, often with a small loss each time. This is called a whipsaw.
Two quick checks tell you when to stand aside:
- Slope. If the slow average is flat, there is no trend to follow.
- Spacing. If the two lines keep touching and separating every few candles, the market is ranging.
See trend vs range markets for how to tell the two apart from price alone.
The 4-step plan: cross, then pullback
The crossover tells you the trend may have changed. The entry comes later.
- Cross and slope. The 20 crosses above the 50 and the 50 has stopped falling (flat to rising). Check one higher timeframe agrees, or at least is not in a strong downtrend. See how to use multiple timeframes.
- Wait for the pullback. After the cross, price usually runs and then pulls back. A pullback that holds near the 20 average, or at a support level that was resistance before, is the area to watch. Do not chase the candles right after the cross.
- Price trigger. At the pullback, wait for price to turn: a close back above the last small swing high of the pullback, or a strong bullish candle off the level.
- Stop and size. The stop goes below the pullback low with a buffer, not at a random distance and not just under the average (averages move). Size the position from that stop. See how to set a stop loss.
The bearish version is the mirror: cross down, slow average flat to falling, rally back to the 20 or a resistance level, a close below the last small swing low, stop above the rally high.
Worked example
These numbers are illustrative and not tied to any live market.
A stock has been falling for weeks on the daily chart. Then it bottoms near 41 and rallies. Eight days later the 20 day SMA crosses above the 50 day SMA, around 45. The 50 day average has flattened out. The weekly chart is sideways, not falling.
Price keeps going to 50.5, then pulls back over five days to 47.2, right where the rising 20 day average sits and close to 47, the top of the last bounce during the decline.
- Trigger: the last small swing high of the pullback is 48.4. A day closes at 48.6: the trigger.
- Entry: about 48.6.
- Stop: below the pullback low of 47.2 with a buffer, at 46.6.
- Target: the recent high at 50.5 first, then the next resistance near 53.
Risk is 2.0 per share. Reward is 1.9 to the first target and 4.4 to the second, so about 1 to 1 and 1 to 2.2. A common way to handle that: take part of the position at 50.5 and move the stop to break even, then let the rest work toward 53. The risk reward calculator checks the ratio, and the position size calculator turns the 2.0 stop distance into a share count for your account.
Notice what the crossover did: it did not give the entry. It said the trend had probably turned, and the pullback to a level gave a place to enter with a tight, logical stop.
Common mistakes
- Buying the cross candle. The cross often comes after a fast move. Entering right there puts the stop far away and the entry at a short term high.
- Trading crosses in a range. Flat averages that keep tangling mean no trend. Every cross is a coin flip.
- Changing the lengths after every loss. 9 and 21, then 10 and 30, then 20 and 50: optimizing until the past looks perfect does not make the next trade better. Pick a pair and judge the setups.
- Using the average as the stop. Price often dips through a moving average and recovers. Put the stop beyond the pullback low, where the idea is clearly wrong.
- Ignoring the bigger picture. A bullish cross on the 15 minute chart inside a daily downtrend is a short term bounce until proven otherwise.
FAQ
What is the best moving average crossover?
There is no single best pair. The 20 and 50 are common for swing trading, the 50 and 200 for long term trends, and shorter pairs like 9 and 21 for intraday charts. Shorter pairs give earlier signals and more false ones. Choose one and test it on your own market before trusting it.
What is a golden cross?
It is when the 50 day moving average crosses above the 200 day moving average. It describes a long term trend turning up. It is a slow signal and works better as context than as an entry.
Should I use SMA or EMA for crossovers?
EMAs react faster and give earlier crosses with more whipsaws. SMAs are smoother and later. The plan in this guide works with either.
Do moving average crossovers work in crypto and forex?
The logic is the same on any market with a chart. Crypto trades all week and moves fast, so crosses on very low timeframes are noisy. Forex pairs often range for long periods, so the slope and spacing checks matter even more.
How is a moving average crossover different from a MACD crossover?
MACD is built from moving averages: it is the 12 period EMA minus the 26 period EMA, with a signal line. A MACD crossover reacts earlier than a 20/50 crossover but is noisier. See MACD crossover signals.
Try it on your own chart
ChartEdge AI reads a chart screenshot and gives you the trend, key levels and a plan with entry, stop and targets, so you can check whether a crossover sits at a level that matters. Try it with 3 free analyses, no card required. Educational only, not financial advice.