The MACD line crosses above the signal line and a lot of traders hit buy. Sometimes that works. Often the move is already half done, or the market is chopping sideways and the next crossover goes the other way two candles later.
This guide explains what a MACD crossover actually measures, why it always arrives late, and a simple checklist that turns it from a reflex into a plan.
MACD in one paragraph
MACD stands for Moving Average Convergence Divergence. It has three parts, all built from closing prices:
- MACD line: the 12 period exponential moving average (EMA) minus the 26 period EMA. When short term prices rise faster than longer term prices, it goes up.
- Signal line: a 9 period EMA of the MACD line. A smoother, slower copy.
- Histogram: the MACD line minus the signal line. The bars grow when the two lines move apart and shrink when they come together.
The default settings are 12, 26 and 9 on almost every charting platform. MACD has no fixed top or bottom like the RSI: its values depend on the price of the market.
The bullish crossover
The MACD line crosses above the signal line. Short term momentum has turned up faster than the recent average. On the histogram, the bars flip from below zero to above zero.
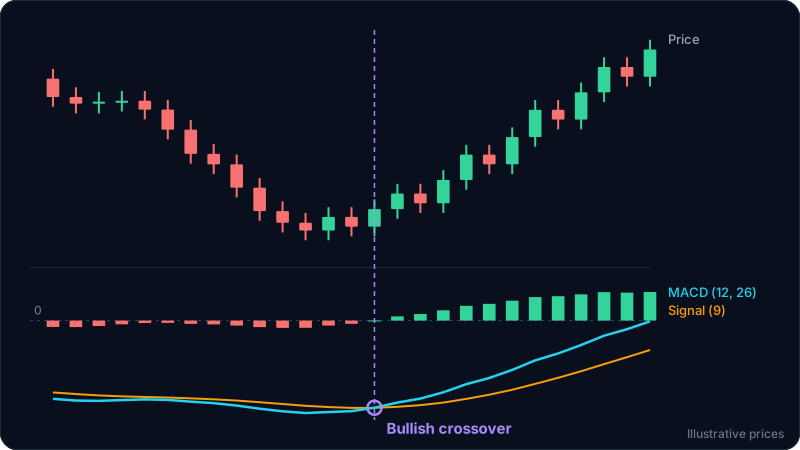
Look at where the crossover sits in the diagram: price had already made its low and started to climb a few candles before the lines crossed. That is normal. MACD is made of moving averages of moving averages, so it always confirms a turn after price has started it.
The bearish crossover
The MACD line crosses below the signal line. It is the mirror image: upside momentum is fading and short term prices are falling faster than the recent average. It is read the same way, as a confirmation that momentum turned, not a guarantee of a top.
Zero line crossovers
The zero line is where the 12 and 26 period EMAs are equal.
- MACD above zero: the faster average is above the slower one. Momentum is on the upside overall.
- MACD below zero: the faster average is below the slower one.
A crossover that happens below zero (like the diagram) is an early signal against the recent trend. A crossover above zero in an uptrend is a signal with the trend, usually after a pullback. Beginners tend to do better trading crossovers in the direction of the bigger trend and treating counter-trend crossovers as a warning only.
Why crossovers fail in ranges
In a sideways market the two lines stay close together and cross back and forth every few candles. Each cross looks like a signal and each one gets reversed. The histogram gives it away: tiny bars that flip color constantly mean there is no momentum to follow.
Before trusting any crossover, check whether the market is trending or ranging. See trend vs range markets.
The 4-step checklist
- Trend first. Is price making higher highs and higher lows (or lower lows and lower highs) on your timeframe and one above it? Trade crossovers in that direction. Check one higher timeframe with how to use multiple timeframes.
- Location. A bullish crossover that appears as price pulls back to support (or a bearish one at resistance) means more than one in the middle of a move.
- Price trigger. The crossover says momentum turned. Wait for price to agree: for a long, a close above the last small swing high of the pullback.
- Stop and size. The stop goes beyond the pullback low (for a long) with a buffer, not at a random distance. Then size the position from that stop. See how to set a stop loss.
Worked example
These numbers are illustrative and not tied to any live market.
A coin is in an uptrend on the 4 hour chart: higher highs and higher lows, MACD above zero. It pulls back from 132 to a support zone around 124 to 125, an area that was resistance earlier. During the pullback the MACD line dips under the signal line, but stays above zero.
At 124.6 price stops falling. Two candles later the MACD line crosses back above the signal line, still above zero: a crossover with the trend, at support.
- Trigger: the last small swing high of the pullback was near 127. A candle closes at 127.4: the trigger.
- Entry: about 127.4.
- Stop: below the pullback low with a buffer, around 123.8.
- Target: the prior high near 132, then the next resistance above it.
Risk is 3.6 and reward to the first target is 4.6, about 1 to 1.3. That is acceptable only if the next resistance above 132 gives room to hold part of the position. If it does not, a tighter entry on a retest of 127 improves the ratio. The risk reward calculator checks it in seconds, and the position size calculator turns the stop into a size.
Notice what the crossover did here: it did not pick the entry. It confirmed that the pullback was losing steam at a level that already mattered.
Common mistakes
- Buying every crossover. Without trend, location and a price trigger, a crossover is a coin flip with a delay.
- Trading crossovers in a range. Lines tangled around each other with tiny histogram bars mean no momentum. Stand aside.
- Expecting an early entry. MACD lags by design. If you want the exact bottom, MACD is the wrong tool.
- Tweaking the settings until it fits. Keep 12, 26, 9 and judge the signal, not the parameters.
- Ignoring the stop. If price breaks the pullback low after a bullish crossover, the idea failed. Get out.
FAQ
What is a MACD crossover?
It is when the MACD line crosses its signal line. Crossing above is bullish (momentum turning up), crossing below is bearish (momentum turning down).
Is the MACD crossover a good signal?
It is a useful momentum confirmation, not a complete strategy. It works better in trending markets, in the direction of the trend, at support or resistance, and with a price trigger.
What does the MACD zero line mean?
At zero, the 12 and 26 period EMAs are equal. Above zero, short term momentum is stronger than the longer term average; below zero it is weaker.
MACD or RSI: which is better?
They answer different questions. MACD follows momentum and trend changes with a delay. RSI measures how stretched recent moves are and is often used for divergence. Many traders use one, not both, to keep the chart clean.
What is the best timeframe for MACD crossovers?
Crossovers on the 4 hour and daily charts appear less often and tend to mean more than on 1 or 5 minute charts, where they happen constantly. Use your trading timeframe and check one above it.
Try it on your own chart
ChartEdge AI reads a chart screenshot and gives you the trend, key levels and a plan with entry, stop and targets, so you can check whether a crossover sits at a level that matters. Try it with 3 free analyses, no card required. Educational only, not financial advice.