Price makes a new low, but the RSI underneath does not. That mismatch is called a divergence, and it is one of the most popular signals on any chart. It is also one of the most misused, because a divergence tells you momentum is fading, not that price is about to turn.
This guide explains what RSI divergence is, how to spot it on a screenshot, and a simple checklist that turns it from a guess into a plan.
RSI in one paragraph
The Relative Strength Index (RSI) compares the size of recent up moves with recent down moves and scales the result from 0 to 100. The usual setting is 14 periods. Readings above 70 are often called overbought and below 30 oversold, but in a strong trend RSI can stay there for a long time. For divergence, the exact number matters less than the direction of its swings.
Bullish divergence
Price makes a lower low, RSI makes a higher low. Sellers pushed price to a new low, but with less force than the time before.
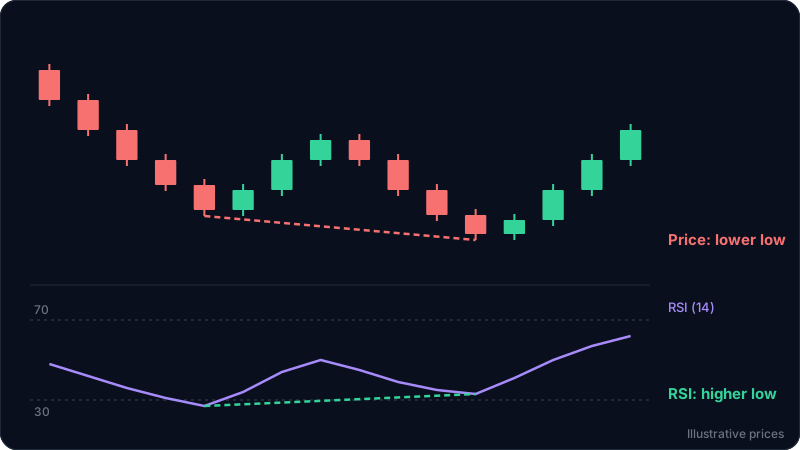
In the diagram, the second price low is below the first (red dashed line), while the RSI low under it is higher than the first (green dashed line). The down move is losing momentum.
Bearish divergence
Price makes a higher high, RSI makes a lower high. Buyers pushed to a new high, but with less strength. It is the mirror image of the bullish case and is read the same way: momentum fading, not a guaranteed top.
Hidden divergence
Hidden divergence points the other way: it suggests the trend may continue.
- Hidden bullish: price makes a higher low, RSI makes a lower low. Common on pullbacks in an uptrend.
- Hidden bearish: price makes a lower high, RSI makes a higher high. Common on rallies in a downtrend.
Beginners usually do better starting with regular divergence at clear levels, and treating hidden divergence as a bonus confirmation for trend trades.
Why divergence alone is not an entry
A divergence can keep building. Price makes a lower low with a higher RSI low, then another lower low with yet another higher RSI low, and keeps falling. Each one looks like a reversal signal, and each one stops out whoever bought it.
That is why divergence works best as a filter, not a trigger. It tells you where to pay attention. The entry still comes from price.
The 4-step checklist
- Context. Where is the divergence? One that forms at a clear support (for bullish) or resistance (for bearish), or at the edge of a range, matters much more than one in the middle of nowhere. See trend vs range markets.
- Clean swings. Compare two clear swing lows (or highs) on price, and the RSI values directly under them. If you have to squint to find the swings, there is no divergence.
- Price trigger. Wait for price to confirm: for bullish divergence, a close above the last lower high of the down move. Until then, the down trend is still intact.
- Stop and size. The stop goes beyond the divergence low (or high) with a buffer: if price makes yet another low, the idea is wrong. Then size from that stop. See how to set a stop loss.
Worked example
These numbers are illustrative and not tied to any live market.
A coin falls from 120 and makes a first low near 105.4, with RSI at 27. It bounces to 113, then falls again to a lower low near 103.0. This time RSI only drops to 33. Price lower low, RSI higher low: bullish divergence. The second low also sits just under the first low, an area buyers already defended once.
- Trigger: the last lower high on the way down was near 108. A candle closes above 108: the trigger.
- Entry: about 108.3.
- Stop: below the divergence low with a buffer, around 102.2.
- Target: the bounce high between the two lows, near 113.
Risk is 6.1 and reward is 4.7, about 1 to 0.8. That is not worth taking. Either wait for a better entry (a retest of the 108 break), or use a further target at the next resistance if one exists above 113. A valid signal does not make a trade worth its risk; the risk reward calculator checks it in seconds.
Common mistakes
- Trading every divergence. Without a level and a price trigger, divergence is just a warning light.
- Fighting a strong trend. In a strong trend, divergence often appears several times before anything turns. Respect the structure first.
- Comparing the wrong points. Compare RSI at the same candles as the price swings, not the nearest RSI peak.
- Changing RSI settings until a divergence appears. Keep the standard 14 and the same timeframe.
- Forgetting the stop. If price makes another low beyond the divergence low, the signal failed. Get out.
FAQ
What is RSI divergence?
It is a mismatch between price and the RSI. In bullish divergence, price makes a lower low while RSI makes a higher low. In bearish divergence, price makes a higher high while RSI makes a lower high. It shows momentum fading.
Is RSI divergence reliable?
It is a useful warning, not a reliable signal on its own. It works better at clear support or resistance and with a price confirmation, such as a close beyond the last swing.
Which timeframe is best for RSI divergence?
Divergence on higher timeframes (4 hour, daily) tends to matter more than on 1 or 5 minute charts, where it appears constantly. Use the same timeframe you trade and check one higher for context.
What is the difference between regular and hidden divergence?
Regular divergence warns of a possible reversal. Hidden divergence suggests the existing trend may continue after a pullback.
Should I change the RSI period?
Most traders keep the default 14. Changing it until a divergence appears is curve fitting and makes the signal meaningless.
Try it on your own chart
ChartEdge AI reads a chart screenshot and gives you the trend, key levels and a plan with entry, stop and targets, so you can check whether a divergence sits at a level that matters. Try it with 3 free analyses, no card required. Educational only, not financial advice.