AI Bitcoin chart analysis
Bitcoin moves fast. Upload a BTC chart from any exchange or charting tool and get a structured read of the trend, key levels and a complete trade plan in seconds, on any timeframe from 1 minute to weekly.
What you get from one screenshot
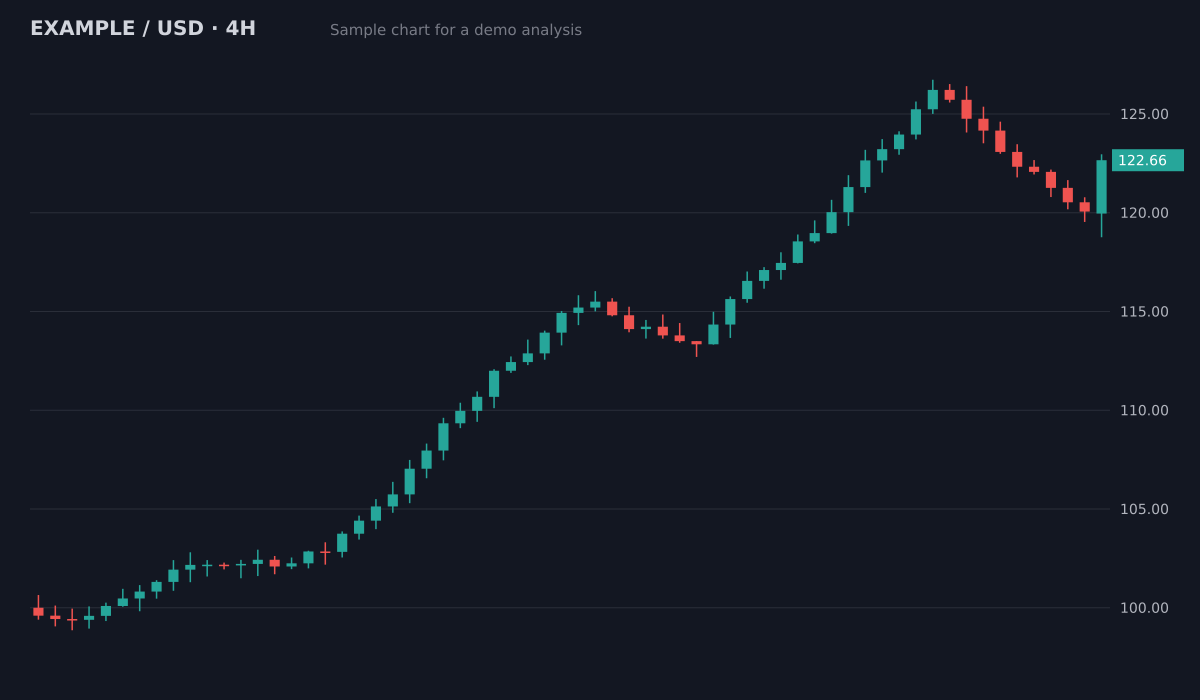
- Bias
- Bullish, pullback in an uptrend
- Structure
- Higher highs and higher lows since 100; pullback held above the 119.5 breakout area
- Key levels
- Resistance126.5 (swing high)
- Support119.5 to 120 (old breakout)
- Support113.5 to 115 (prior range)
- Plan
- Entry zone120.5 to 121.5
- Stop loss118.4
- Target 1126.5 (1:2.1)
- Target 2129.5 (1:3.3)
Invalid if a 4H candle closes below the 119.5 support. Size the position from the stop distance.
Sample chart with illustrative prices, not a live market. Educational, not financial advice.
Try it on your own chartScreenshot BTC
BTCUSD, BTCUSDT or any Bitcoin pair, from TradingView, Binance, Bybit, Coinbase or any other platform.
Upload it
Drop the chart into ChartEdge AI on desktop or phone.
Trade with a plan
Get the bias, entry zone, invalidation level, take profit targets and position size for your risk.
Try it on your chart now
No account needed. Upload a screenshot and see the bias and key levels in seconds.
Levels that matter for Bitcoin
Round numbers, prior swing highs and lows, range boundaries and moving averages are where BTC tends to react. ChartEdge AI marks them and builds the plan around them.
Any timeframe
Scalp the 5 minute chart or plan a swing on the daily. The analysis adapts its levels and targets to the timeframe you upload.
Size every trade
Crypto volatility punishes oversized positions. The built-in position sizer turns your account size and risk percentage into a position size for the stop loss in the plan.
Questions
Can AI predict the Bitcoin price?
No tool can. ChartEdge AI gives a structured read of what the chart shows right now and a plan with a clear invalidation level. It is not financial advice.
Does it work for other coins?
Yes. ETH, SOL, XRP and any other coin or token chart work the same way.
What does it cost?
3 free analyses with no card required, then $20 per month. Cancel anytime.
Can AI read a BTC/USDT chart from Binance or TradingView?
Yes. Upload a screenshot with the candles and the price scale visible, spot or perpetual, from any exchange or TradingView, and you get the trend, key levels, entry, stop loss and targets.
Which timeframe should I upload for Bitcoin?
Any timeframe works. Many traders read the 4H or Daily for the main trend, then the 15m or 1H to time an entry. Bitcoin trades 24/7, so weekend candles can be thin and spiky.
Does it account for leverage and liquidation?
The plan gives price levels, not leverage. If you trade futures, check that your liquidation price sits beyond the stop with the free liquidation price calculator.
Try it on your next chart
Upload a screenshot and get a full trade plan in seconds.
3 free analyses. No card required.
Get a plan for your crypto chart
Try free