EUR/USD chart analysis with AI
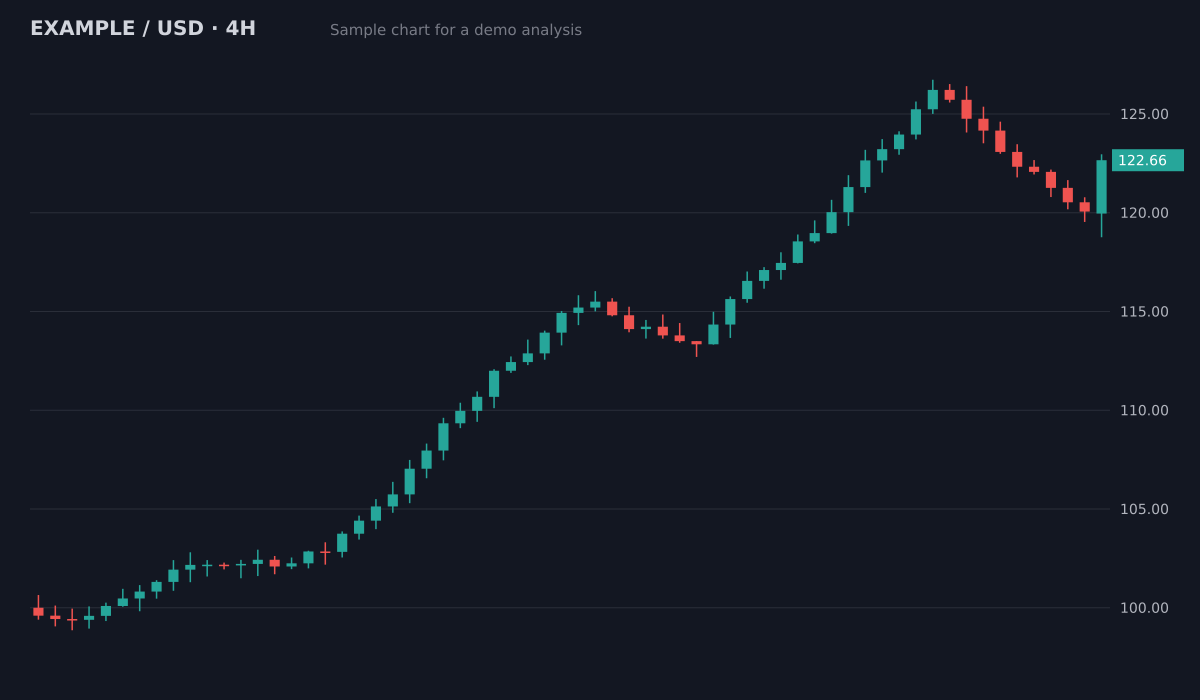
Screenshot your EUR/USD chart and get a structured plan for it: trend, support and resistance, setup, entry, stop loss and targets. The same works for any forex pair.
What you get from one screenshot
- Bias
- Bullish, pullback in an uptrend
- Structure
- Higher highs and higher lows since 100; pullback held above the 119.5 breakout area
- Key levels
- Resistance126.5 (swing high)
- Support119.5 to 120 (old breakout)
- Support113.5 to 115 (prior range)
- Plan
- Entry zone120.5 to 121.5
- Stop loss118.4
- Target 1126.5 (1:2.1)
- Target 2129.5 (1:3.3)
Invalid if a 4H candle closes below the 119.5 support. Size the position from the stop distance.
Sample chart with illustrative prices, not a live market. Educational, not financial advice.
Try it on your own chartScreenshot the pair
EUR/USD or any other pair, from any platform and timeframe.
Upload it
No broker connection, no API keys.
Plan the trade
Entry, stop loss, targets and risk to reward. Turn the stop into a lot size with the pip value and position size calculators.
Try it on your chart now
No account needed. Upload a screenshot and see the bias and key levels in seconds.
Every major and cross
EUR/USD, GBP/USD, USD/JPY, AUD/USD, crosses like EUR/GBP and exotics. If the chart shows candles and a price scale, it can be analysed.
From levels to lot size
A plan is only useful if the size is right. Use the free pip value calculator and the position size calculator to turn the stop distance into a lot size that matches your risk.
Mind the sessions and news
EUR/USD liquidity is highest when London and New York overlap. Spreads widen around major releases, so check the calendar before acting on any plan.
Questions
Does it give the stop in pips?
The plan gives price levels for entry, stop and targets. The distance between entry and stop in pips is the difference between the two prices divided by 0.0001 on EUR/USD.
Does it work for other pairs?
Yes, any forex pair, plus indices, stocks, crypto and commodities.
Is it financial advice?
No. ChartEdge AI is an educational analysis tool. Always manage your own risk.
Can AI analyse a EUR/USD chart from MT4, MT5 or TradingView?
Yes. Take a screenshot with the candles and the price scale visible and upload it. No broker connection or API key is needed.
When does EUR/USD move the most?
Usually during the London session and the London and New York overlap, roughly 13:00 to 17:00 UTC in winter. The forex session times guide lists the hours and the releases that move the pair.
Does it convert the plan into lots?
Yes, on pairs quoted in USD such as EUR/USD and GBP/USD. The position sizer under the report turns your balance and risk into a lot size, rounded down to 0.01, with the contract size it assumed. For JPY and other pairs, the free pip value calculator gives the value per pip.
How many pips should a EUR/USD stop loss be?
There is no fixed number of pips: the stop goes just beyond the level that proves the idea wrong, and the lot size comes from that distance. A stop smaller than the normal candle range of your timeframe gets hit by noise, so compare it with a few recent candles first.
Which timeframe is best for EUR/USD day trading?
Many day traders read the direction on the 1H and time the entry on the 15M or 5M. Upload the 1H first for the trend and levels, then the lower timeframe for the entry; the best timeframe for day trading guide explains the split.
Why was my EUR/USD stop hit before the chart reached it?
Usually the spread. Most charts show the bid price, and a short trade closes at the ask, which sits higher by the spread. When the spread widens around news or at the daily rollover, the ask can touch your stop while the chart line stays below it. Leave at least the usual spread as room above a short stop.
Try it on your next chart
Upload a screenshot and get a full trade plan in seconds.
3 free analyses. No card required.
Get a plan for your forex chart
Try free