An AI chart analysis app that runs in your phone browser
Most chart checks happen on a phone. Screenshot the chart in the app you already use, open ChartEdge AI in your phone browser, upload the image and get the trend, the key levels and a full trade plan in seconds. Nothing to download from an app store.
What you get from one screenshot
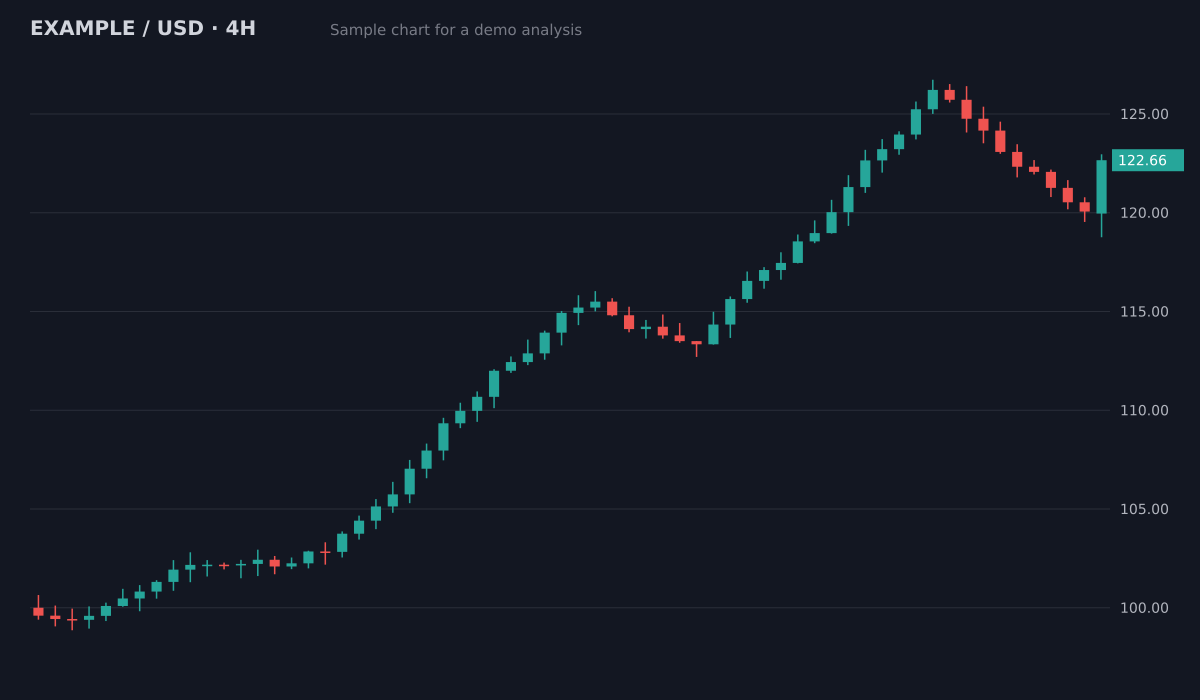
- Bias
- Bullish, pullback in an uptrend
- Structure
- Higher highs and higher lows since 100; pullback held above the 119.5 breakout area
- Key levels
- Resistance126.5 (swing high)
- Support119.5 to 120 (old breakout)
- Support113.5 to 115 (prior range)
- Plan
- Entry zone120.5 to 121.5
- Stop loss118.4
- Target 1126.5 (1:2.1)
- Target 2129.5 (1:3.3)
Invalid if a 4H candle closes below the 119.5 support. Size the position from the stop distance.
Sample chart with illustrative prices, not a live market. Educational, not financial advice.
Try it on your own chartScreenshot the chart
In TradingView, MetaTrader, your exchange app or your broker app. Keep the candles, price scale and timeframe on screen.
Upload from your phone
Open chartedge.app in Safari or Chrome and pick the screenshot from your photos. Add it to your home screen to open it like an app.
Read the plan
Bias, setup, entry zone, stop loss, targets and risk to reward, laid out for a phone screen.
Try it on your chart now
No account needed. Upload a screenshot and see the bias and key levels in seconds.
No app store, no install
ChartEdge AI is a web app. It works the same on iPhone, Android, tablet and desktop, and your analyses are saved to the same account on every device.
Works with the apps you already use
Screenshots from TradingView, MetaTrader 4 and 5, Binance, Bybit, Coinbase and broker apps all work. There is no account to connect and no API key to paste.
Check the plan before you tap buy
A second read on the phone helps catch what you missed on a small screen: a level just above your entry, a stop inside normal noise, or a target that leaves a poor risk to reward.
Learn and plan for free
Questions
Is there an iPhone or Android app to download?
Not as a store app. ChartEdge AI runs in your phone browser, and you can add it to your home screen so it opens like an app.
Do phone screenshots work as well as desktop ones?
Yes, as long as the candles, the price scale and the timeframe are visible. Turning the phone sideways gives a wider chart and a better read.
Can I try it without an account?
Yes. The demo on this page reads a chart without signing up. With a free account you get 3 full analyses with entry, stop and targets, no card required.
How much does it cost?
3 free analyses, then $20 per month. Cancel anytime. Educational analysis, not financial advice.
Is there an AI app that analyses charts from a screenshot?
Yes. ChartEdge AI runs in your phone browser: upload a chart screenshot and get the trend, key levels, entry, stop loss, targets and risk to reward in seconds.
Does it connect to my broker or exchange?
No. It only needs the image. It never asks for broker or exchange logins or API keys, and it never places trades.
Which markets can I analyse on my phone?
Any chart with candles and a price scale: crypto, forex, gold and other metals, indices and stocks, on any timeframe.
Can I add ChartEdge to my phone's home screen?
Yes. In Safari tap Share, then Add to Home Screen; in Chrome open the menu, then Add to Home screen. It then opens like an app, with no download from an app store.
How long does an analysis take on a phone?
Usually a few seconds after the upload finishes. A clear screenshot with the price scale visible gives the best read; a slow mobile connection only delays the upload.
Try it on your next chart
Upload a screenshot and get a full trade plan in seconds.
3 free analyses. No card required.
Analyse a chart from your phone
Try free