GBP/USD chart analysis with AI
Screenshot your GBP/USD (cable) chart from MetaTrader, TradingView or your broker app and get a structured plan: trend, support and resistance, setup, entry, stop loss and targets.
What you get from one screenshot
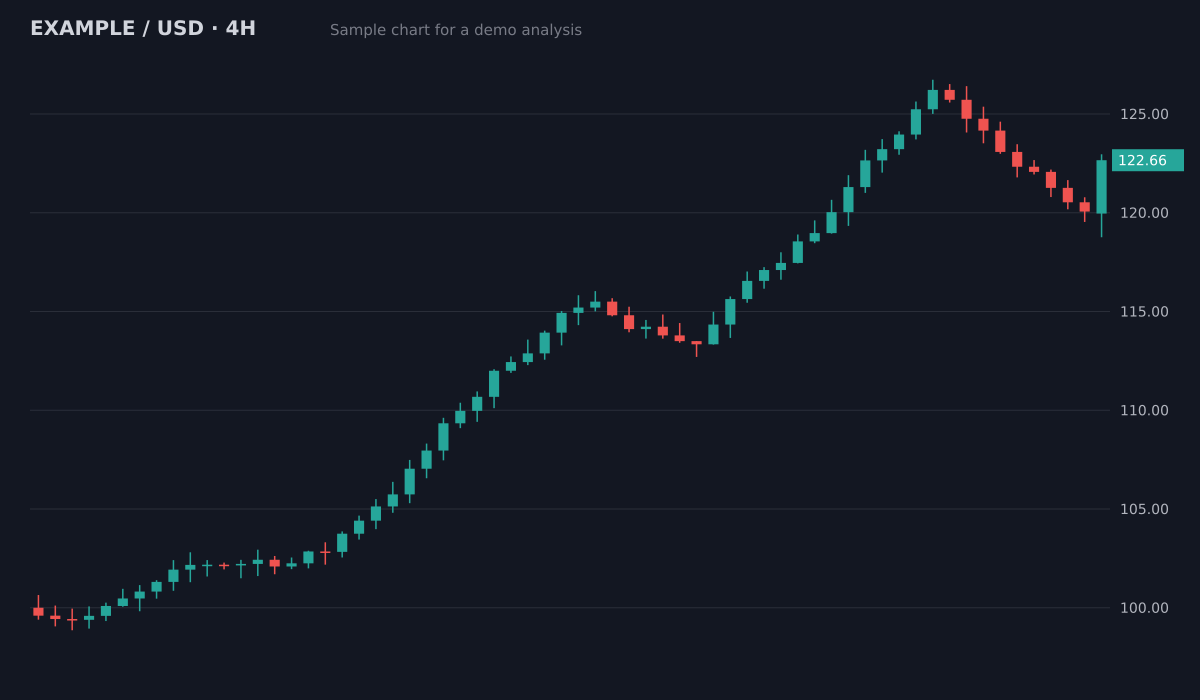
- Bias
- Bullish, pullback in an uptrend
- Structure
- Higher highs and higher lows since 100; pullback held above the 119.5 breakout area
- Key levels
- Resistance126.5 (swing high)
- Support119.5 to 120 (old breakout)
- Support113.5 to 115 (prior range)
- Plan
- Entry zone120.5 to 121.5
- Stop loss118.4
- Target 1126.5 (1:2.1)
- Target 2129.5 (1:3.3)
Invalid if a 4H candle closes below the 119.5 support. Size the position from the stop distance.
Sample chart with illustrative prices, not a live market. Educational, not financial advice.
Try it on your own chartScreenshot the pair
GBP/USD from any platform and timeframe. Keep the price scale visible.
Upload it
No broker connection, no API keys.
Plan the trade
Entry, stop loss, targets and risk to reward. Turn the stop into a lot size with the pip value and position size calculators.
Try it on your chart now
No account needed. Upload a screenshot and see the bias and key levels in seconds.
A London pair
GBP/USD is usually most active from the London open through the overlap with New York. Setups that form in the quiet Asian hours often need the London session to follow through.
Two central banks, two calendars
Bank of England and Federal Reserve decisions, UK and US inflation and US jobs data can move cable fast. Check the calendar before acting on a plan and expect wider spreads around releases.
From levels to lot size
GBP/USD can travel 100 pips or more in a day. Plans place the stop beyond structure, and the free pip value and position size calculators turn that distance into a lot size that matches your risk.
Questions
Does it work with MetaTrader screenshots?
Yes. Clear MT4 and MT5 screenshots work, as do TradingView and broker app charts.
Does it work for GBP/JPY and EUR/GBP?
Yes. Any forex pair with visible candles and a price scale can be analysed.
What does it cost?
3 free analyses with no card required, then $20 per month. Cancel anytime.
Try it on your next chart
Upload a screenshot and get a full trade plan in seconds.
3 free analyses. No card required.
Get a plan for your GBP/USD chart
Try free