Gold scalping chart analysis with AI
Screenshot your 1, 5 or 15 minute XAU/USD chart from MetaTrader, TradingView or your broker app and get a structured scalp plan: direction, the levels in play, an entry zone, a stop beyond structure and targets, with a reminder to check the 1H chart first.
What you get from one screenshot
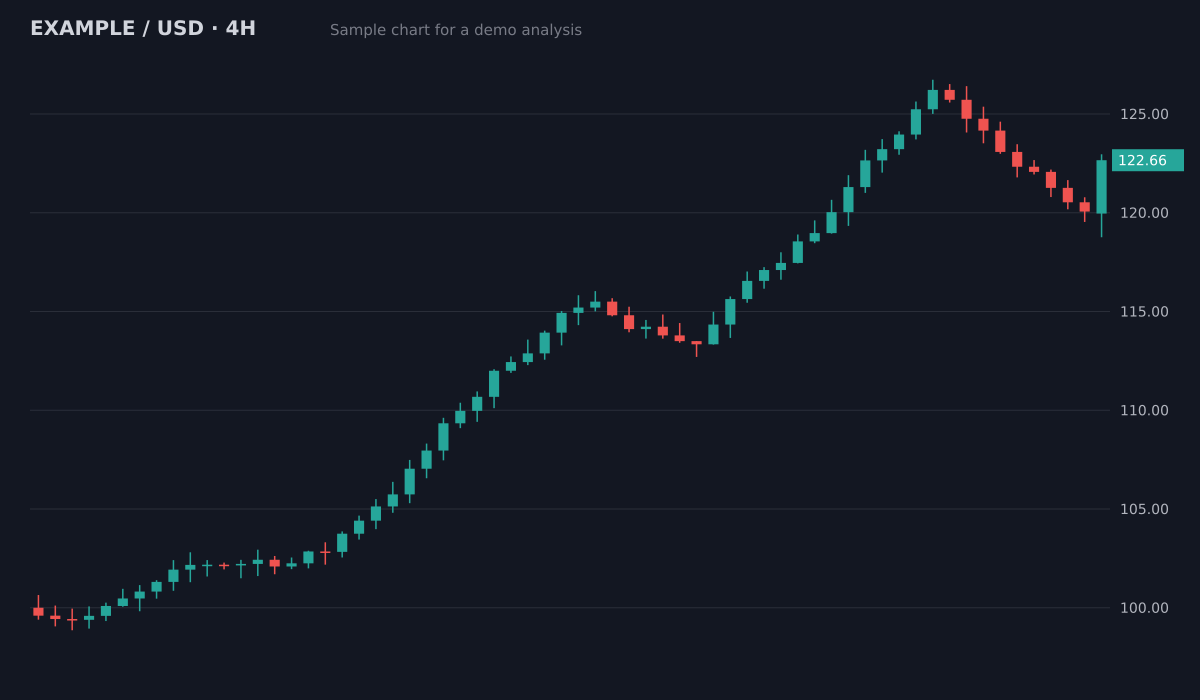
- Bias
- Bullish, pullback in an uptrend
- Structure
- Higher highs and higher lows since 100; pullback held above the 119.5 breakout area
- Key levels
- Resistance126.5 (swing high)
- Support119.5 to 120 (old breakout)
- Support113.5 to 115 (prior range)
- Plan
- Entry zone120.5 to 121.5
- Stop loss118.4
- Target 1126.5 (1:2.1)
- Target 2129.5 (1:3.3)
Invalid if a 4H candle closes below the 119.5 support. Size the position from the stop distance.
Sample chart with illustrative prices, not a live market. Educational, not financial advice.
Try it on your own chartScreenshot the fast chart
XAU/USD or GOLD on the 1, 5 or 15 minute chart, from MT4, MT5, TradingView or any broker app. Keep the price scale and the timeframe visible.
Check the 1H too
Upload the 1 hour chart as well to see the direction and the bigger levels before you take a fast entry.
Get the plan
Bias, entry zone, stop loss, targets and risk to reward, with a note that fast-chart levels are zones, not exact prices.
Try it on your chart now
No account needed. Upload a screenshot and see the bias and key levels in seconds.
Levels are zones on fast charts
On a 1 or 5 minute gold chart, a few quick candles can run past a level before price turns. Reports on 1 to 15 minute charts say so: read the entry and the stop as zones and keep the stop in place.
Direction from the 1 hour chart
Many losing scalps fight the bigger move. Take the direction and the main levels from the 1H chart, then use the 5 or 15 minute chart only to time the entry. The multiple timeframes guide explains the method.
Spreads and US data
Gold spreads often widen around US data releases and at the daily rollover. A scalp stop of a few dollars can be hit by the spread alone, so check the economic calendar and your broker's spread before you enter.
Size from the stop
Keep the risk in money fixed and size the position from the stop distance. The position size and pip value calculators do the arithmetic for gold.
Learn and plan for free
- Guide: How to Trade Gold on the 15 Minute Chart
- Guide: How to Use the ATR to Set a Stop Loss (Gold and Forex, 5 and 15 Minute Charts)
- Guide: How to Trade the New York Open on Gold (13
- Guide: How to Trade the London Open on Gold and EUR/USD
- Free position size calculator
- Free gold (XAU/USD) pip value calculator
- Free risk reward calculator
Questions
Does it work on a 1 minute gold chart?
Yes. It reads 1, 5 and 15 minute XAU/USD charts like any other. Very fast charts carry more noise, so the report marks the levels as zones and asks you to check the 1H direction.
What is the best timeframe for scalping gold?
There is no single best one. Many scalpers take the direction from the 1 hour chart and time entries on the 5 or 15 minute chart. Test one combination and judge it in your trade log.
Can AI give me gold scalping signals?
No. It reads structure, levels and patterns from your screenshot. It cannot see the news, the spread or the order book, and it does not place trades. Educational analysis, not financial advice.
Why does price run past my levels on M1 and M5?
Fast charts react to every order, spreads widen around news, and stops just beyond obvious levels often get swept before price turns. Wider zones, a stop beyond structure and the 1H direction help.
Does it work with MetaTrader 4 and 5 screenshots?
Yes. Any clear screenshot of a gold chart works, from MT4, MT5, TradingView, cTrader or a broker app.
How big should a gold scalping stop loss be?
Wider than the normal candle on your entry chart and beyond the nearest structure, not a fixed number of dollars. If an average 5 minute XAU/USD candle is 2 dollars tall, a 1.50 dollar stop sits inside the noise. A common check: put the stop beyond the level plus 0.5 to 1 ATR(14) of your entry chart, and skip the trade if that leaves it under 1 ATR from the entry. Size the position from the stop so the risk in money stays the same. The ATR stop loss guide shows it on a 5 minute gold chart. Not financial advice.
What happens to the gold spread during news?
It usually widens, sometimes to several times its normal size. That lasts a few seconds to a few minutes around US releases such as NFP, CPI and Fed decisions, and at the daily rollover. A tight scalp stop can be hit by the spread alone, so many scalpers stay flat around the release.
When is the best time of day to scalp gold?
The London session and the London and New York overlap, when most XAU/USD movement happens. Most scalpers trade those hours and avoid the quiet Asian hours and the rollover. The gold trading sessions guide lists the times.
What time is the London open for gold in UTC?
08:00 UTC in winter (late October to late March) and 07:00 UTC in summer, with Frankfurt one hour earlier. Many gold scalpers wait for the first 15 minute candle after the open to close before they trade. Check the time in your platform, because MetaTrader shows server time, often UTC+2 or UTC+3.
How do I scalp the Asian range break at the London open?
Mark the Asian high and low before the open. If a 15 minute candle trades through one side and closes back inside, that is a false break: the stop goes beyond the wick, not on the line. If it closes outside and the pullback holds, the break is real. The London open guide walks through both with a worked example. Not financial advice.
How do I scalp gold at the 13:30 UTC US data?
Main US data comes out at 08:30 New York time: 13:30 UTC in winter and 12:30 UTC in summer. Close or protect open trades before it, do not trade the release candle (the spread is wide and the first spike often reverses), let the 15 minute candle close, then only take a retest of the pre-release high or low with the stop beyond the pullback. If the candle wicks both ways, stand aside. The New York open guide has two worked examples. Not financial advice.
What does it cost?
3 free analyses with no card required, then $20 per month. Cancel anytime.
Try it on your next chart
Upload a screenshot and get a full trade plan in seconds.
3 free analyses. No card required.
Plan your gold scalp levels before the move
Try free