Nasdaq and index chart analysis with AI
Screenshot your NAS100, US500, US30 or DAX chart from TradingView, MetaTrader or your broker app and get a structured plan: trend, key levels, setup, entry, stop loss and targets.
What you get from one screenshot
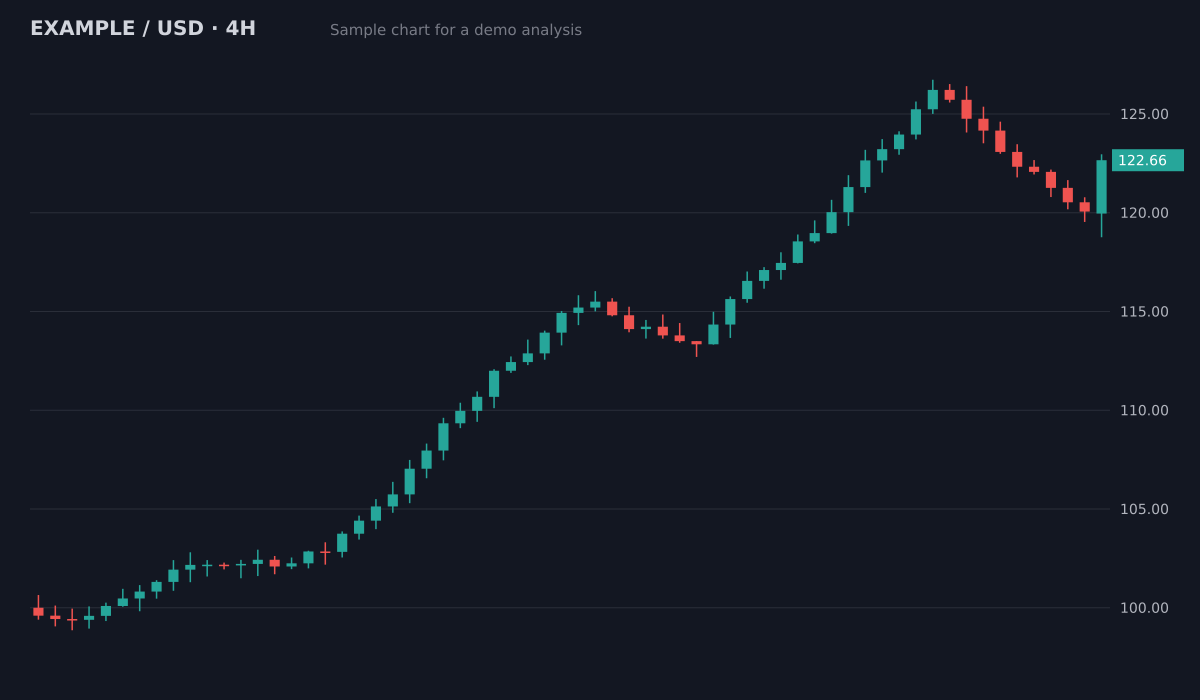
- Bias
- Bullish, pullback in an uptrend
- Structure
- Higher highs and higher lows since 100; pullback held above the 119.5 breakout area
- Key levels
- Resistance126.5 (swing high)
- Support119.5 to 120 (old breakout)
- Support113.5 to 115 (prior range)
- Plan
- Entry zone120.5 to 121.5
- Stop loss118.4
- Target 1126.5 (1:2.1)
- Target 2129.5 (1:3.3)
Invalid if a 4H candle closes below the 119.5 support. Size the position from the stop distance.
Sample chart with illustrative prices, not a live market. Educational, not financial advice.
Try it on your own chartScreenshot the index
Cash index, CFD (NAS100, US100, US500, US30, GER40) or futures, on any platform and timeframe.
Upload it
No broker login needed. ChartEdge AI only reads the image.
Get the plan
Bias, entry zone, stop loss, targets and risk to reward in index points, with the reasoning behind each level.
Try it on your chart now
No account needed. Upload a screenshot and see the bias and key levels in seconds.
The open matters
US index CFDs and futures trade almost around the clock on weekdays, but the biggest moves often come after the New York cash open at 9:30 Eastern time. Plans built on overnight ranges should be checked again after the open.
Gaps and prior day levels
Index traders watch the previous day's high, low and close, overnight highs and lows, and round numbers. ChartEdge AI marks the horizontal levels visible on your chart and builds targets around them.
Stops in points, size from the stop
Indices can move hundreds of points in a session. Plans place the stop beyond structure, and the position size calculator turns that point distance into a size that fits your risk.
Questions
Which indices work?
Any index chart with visible candles and a price scale: Nasdaq 100, S&P 500, Dow Jones (US30), DAX, FTSE, Nikkei and others, as cash index, CFD or futures.
Does it work for scalping the open?
It works on any timeframe, including 1 and 5 minute charts. Fast markets around the open can move past levels quickly, so size small and treat the plan as a second opinion. Not financial advice.
What does it cost?
3 free analyses with no card required, then $20 per month. Cancel anytime.
Can AI analyse a Nasdaq 100 (NAS100, US100) chart?
Yes. Upload a screenshot of the index, a CFD such as NAS100 or US100, or the NQ futures, from any platform, and you get the trend, key levels, entry, stop loss and targets.
Does it know when the US market opens?
It reads the chart only, not the clock. The US cash session opens at 9:30 a.m. New York time, and moves often speed up then and around US data, so check the time and the calendar yourself.
Does it work for single stocks like Apple or Nvidia?
Yes. Any stock chart screenshot works the same way, from TradingView, a broker app or any platform, on any timeframe.
Try it on your next chart
Upload a screenshot and get a full trade plan in seconds.
3 free analyses. No card required.
Get a plan for your index chart
Try free