AI analysis for OTC charts
OTC pairs such as EUR/USD OTC or AUD/NZD OTC trade on some broker platforms when the real market is closed, including weekends. Take a screenshot of the OTC chart, upload it, and get a structured read of the trend, the zones price reacted to, and a written plan with entry, stop and target. The report treats OTC prices as what they are: the broker's own feed, not the live market.
What you get from one screenshot
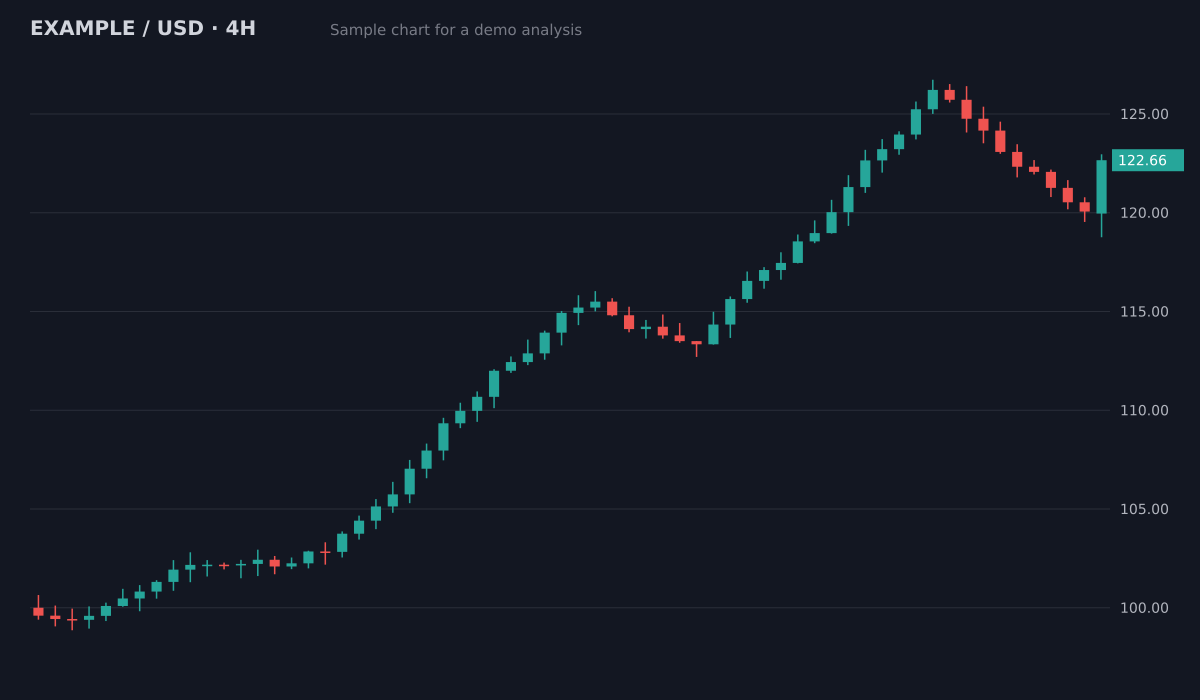
- Bias
- Bullish, pullback in an uptrend
- Structure
- Higher highs and higher lows since 100; pullback held above the 119.5 breakout area
- Key levels
- Resistance126.5 (swing high)
- Support119.5 to 120 (old breakout)
- Support113.5 to 115 (prior range)
- Plan
- Entry zone120.5 to 121.5
- Stop loss118.4
- Target 1126.5 (1:2.1)
- Target 2129.5 (1:3.3)
Invalid if a 4H candle closes below the 119.5 support. Size the position from the stop distance.
Sample chart with illustrative prices, not a live market. Educational, not financial advice.
Try it on your own chartScreenshot the OTC chart
Keep the pair name with OTC, the timeframe and the price scale visible. Close the trade panel or the asset list if it covers the candles.
Upload it
Open ChartEdge AI in your phone or computer browser and drop the image in. No broker login, nothing to install.
Get the plan
Trend or range, the zones on this chart, entry, stop, target and risk to reward in plain language, with a note that OTC levels are read from this chart only.
Try it on your chart now
No account needed. Upload a screenshot and see the bias and key levels in seconds.
What an OTC quote is
An OTC price comes from the broker's own feed, not from the interbank forex market. That is why an OTC pair can move on a Sunday and why its chart can differ from the real EUR/USD chart at the same moment. News calendars and session times do not drive it the way they drive the real pair.
How the report reads OTC charts
Only from the chart's own structure: the swings, the zones where price turned, and whether it is trending or ranging. It does not cite news, sessions or the real pair, and it reads the entry and stop as zones rather than exact prices.
Risk first on fast OTC charts
Most OTC charts are 1 to 5 minute charts, where a few candles can run through any level. Decide the most you accept to lose on one trade before you look at the plan, and skip the trade when the chart is choppy with no clear swings.
Questions
Can AI analyze OTC charts?
Yes. ChartEdge AI reads the candles on any chart screenshot, OTC included. The report says the price is the broker's own feed and reads the levels from this chart's structure only.
Why does my OTC chart not match the real EUR/USD chart?
Because an OTC price is made by the broker, not taken from the live market. The two charts can differ at the same moment, and the OTC pair keeps moving when the real market is closed.
Which timeframe should I screenshot for OTC?
Include enough history to show the last few swings: on a 1 minute chart that means zooming out to see at least an hour of candles. One higher timeframe from the same platform helps for direction.
Does ChartEdge connect to my broker?
No. It never asks for a broker login or an API key. It only reads the screenshot, so it cannot see your balance or place trades. ChartEdge AI is independent and not affiliated with any broker.
Can an AI predict OTC moves?
No tool can. The report gives a structured read and a plan with defined risk, not a prediction or a signal to follow blindly. Educational analysis, not financial advice.
Is there a free trial?
Yes. Your first 3 analyses are free with no card required. Then it is $20 per month. Educational analysis, not financial advice.
Try it on your next chart
Upload a screenshot and get a full trade plan in seconds.
3 free analyses. No card required.
Read your OTC chart as zones
Try free