A bull flag is a strong move up, followed by a short, orderly pullback, followed by another push in the same direction. The bear flag is the same thing upside down. They are continuation patterns: they do not predict a reversal, they describe a trend taking a breath.
Flags are popular because the stop is usually close and the target is far, so the risk reward can be attractive. They are also easy to see where there is nothing. This guide shows what separates a real flag from a random pullback, when the pattern is confirmed, how to set the target and the stop, and walks through a full example.
What the pattern looks like
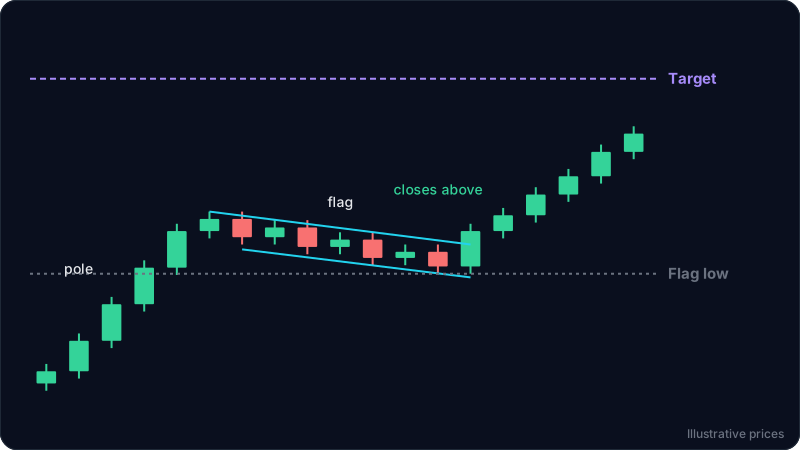
A bull flag has two parts:
- The pole. A fast, strong move up: several large green candles in a row with small wicks, often breaking out of a level. This is what makes it a flag and not just a range.
- The flag. Price pauses and drifts slightly down or sideways in a small, tight channel. The candles get smaller. Buyers take profit, but sellers cannot push price back to where the pole started.
The bear flag is the mirror: a sharp drop (the pole), then a weak bounce that drifts up in a small channel (the flag), then the next leg down.
The logic is simple. A strong pole shows one side is in control. A shallow, slow pullback shows the other side has no real force. When price breaks out of the flag in the direction of the pole, the trend resumes.
What makes a flag valid
Not every pause after a move is a flag. A few practical rules:
- A real pole. The move before the flag should be clearly faster and larger than normal for that chart. A slow grind up followed by a pause is just a trend with a pullback.
- A shallow flag. In a bull flag, the pullback usually gives back well under half of the pole. If price retraces most of the pole, the buyers were not as strong as they looked, and the pattern is closer to a range or a reversal.
- A short flag. The flag should be shorter in time than the pole is long, or close to it. A flag that drags on for many times the length of the pole loses its meaning.
- Shrinking candles. Smaller candles and less volume in the flag (where volume is shown) suggest the pullback is profit taking, not a change of control. It is a clue, not a requirement.
- Context. A bull flag inside a higher timeframe uptrend carries more weight than one that runs straight into a major resistance zone. See how to use multiple timeframes.
When the pattern is confirmed
Draw a line along the highs of the flag. The confirmation is a candle close above that line for a bull flag, or below the line along the flag's lows for a bear flag. A wick that pokes through and closes back inside is not a break. It is the same rule as in breakout vs fakeout.
Some traders wait for a close above the pole's high instead. It is a stronger confirmation, but the entry is later and the stop is further away.
The measured target
Measure the height of the pole: the distance from where the strong move started to the top of the pole. Add it to the breakout point for a bull flag, or subtract it from the breakout point for a bear flag.
- Bull flag target = breakout price + pole height
- Bear flag target = breakout price - pole height
Treat it as a planning level, not a promise. If a strong resistance zone sits before the target, that zone is a more realistic first target. Many traders take part of the position off at the first target and keep the rest.
Where the stop goes
Two common places for a bull flag:
- Below the flag low, with a small buffer. If price falls back through the bottom of the flag after breaking out, the pattern has failed.
- Below the last swing low inside the flag. Tighter, and the risk reward looks better, but noise will stop you out more often.
For a bear flag, the stop goes above the flag high. Pick the stop first, then size the position from the stop distance. See how to set a stop loss.
Worked example
These numbers match the diagram above. Prices are illustrative.
- Pole: price runs from 100 to 112.5 in six candles. Pole height is 12.5.
- Flag: price drifts down in a small channel for seven candles, with lower highs and lower lows, to a low at 108. That is a pullback of 4.5, about 36% of the pole, which is shallow.
- Confirmation: a candle closes at 111.5, above the flag's upper line (about 110.4 at that point).
- Entry: about 111.5, on that close.
- Stop: 107.5, just below the flag low. Risk is 4 per unit.
- Target: 111.5 + 12.5 = 124. Reward is 12.5 per unit.
- Ratio: 12.5 / 4, about 1 to 3.1.
The risk reward calculator checks that ratio, and the position size calculator turns the 4 point stop into a size for your account.
The bear flag works the same way upside down: entry on a close below the flag's lower line, stop above the flag high, target the breakout price minus the pole height.
Flag vs pennant vs wedge
- Pennant: the same pole, but the pause forms a small triangle with converging lines instead of a parallel channel. It is traded the same way.
- Wedge: a slower, longer pattern where both lines slope in the same direction and converge. A rising wedge after an uptrend often breaks down, which is the opposite of a bull flag. If the "flag" slopes up and narrows after a long uptrend, be careful.
- Range: a long sideways pause with no clear pole before it. It has no direction bias until it breaks. See trend vs range markets.
Common mistakes
- Calling any pullback a flag. Without a fast pole, there is no flag. A slow trend with a pullback is just a trend.
- Buying inside the flag. Until price closes out of the flag, the pullback can keep going and turn into a reversal.
- Ignoring how deep the flag went. A "bull flag" that gave back 80% of the pole is not a flag anymore.
- Chasing a late breakout. If the breakout candle is huge and you enter at its close, the stop below the flag low may be so far away that the ratio no longer works. Wait for a retest or skip it.
- Using the same size with a wider stop. See position sizing for a $1,000 account.
FAQ
Is a bull flag bullish?
It is a bullish continuation pattern once price closes above the flag. Before that, it is a pullback in an uptrend that can still turn into something else. No pattern guarantees a move, and we do not quote success rates because they depend on the market, the timeframe and how the pattern is defined.
How long should a flag last?
There is no fixed number of candles. A useful rule of thumb is that the flag should not last much longer than the pole took to form. The longer it drags on, the more it looks like a range.
What is a bear flag?
The mirror of the bull flag: a sharp drop, a weak bounce that drifts up in a small channel, then a close below the channel that resumes the move down.
Does it work on crypto, forex and gold?
The structure works on any chart and any timeframe. Fast markets like crypto produce many flags on short timeframes, and many of them fail, so check the higher timeframe trend before trading one.
Try it on your own chart
ChartEdge AI reads a chart screenshot and gives you the trend, the key support and resistance zones, the pattern it sees, and a plan with entry, stop and targets. Use it to check whether your flag has a real pole and whether the break has closed before you act. Try it with 3 free analyses, no card required. Educational only, not financial advice.