The head and shoulders is one of the best known chart patterns, and one of the most misused. Traders see two bumps and a higher bump, decide the top is in, and sell before the pattern has done anything. Then price makes a new high and the "pattern" disappears.
The pattern is not a prediction that the top is in. It is a description of buyers getting weaker, and it only becomes a trade when price confirms it. This guide shows what to look for, when the pattern is actually confirmed, where the stop and target go, and how to use the inverse version for long trades.
What the pattern looks like
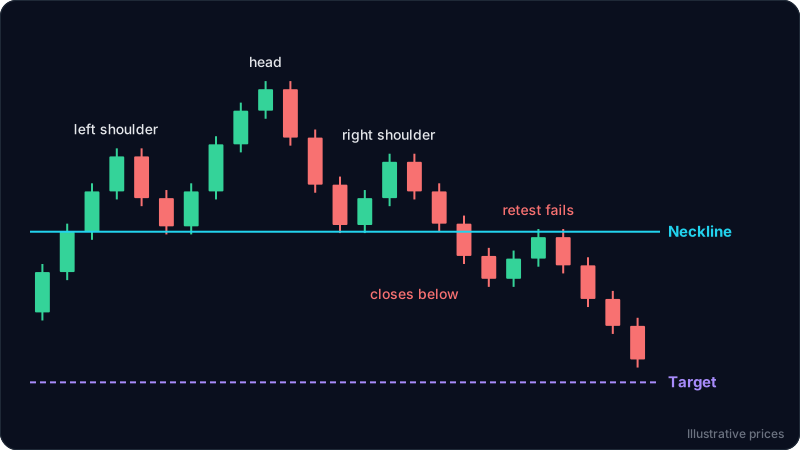
A head and shoulders top forms after an uptrend and has four parts:
- Left shoulder. Price makes a high and pulls back. Nothing unusual yet: this is a normal uptrend.
- Head. Price rallies to a higher high, then falls back to around the same area as the last pullback.
- Right shoulder. Price rallies again but fails below the head. This is the first real warning: the uptrend has made a lower high.
- Neckline. The line through the two pullback lows, between the shoulders and the head. It can be flat or slightly sloped.
The story is simple. In an uptrend, each rally makes a new high. At the right shoulder, buyers could not even get back to the head. If price then closes below the neckline, the structure of higher highs and higher lows from the trend vs range guide is broken on both sides.
When the pattern is confirmed
Until price closes below the neckline, there is no head and shoulders, only a possible one. Many right shoulders turn into a pullback, and the uptrend continues.
Look for these together:
- A close below the neckline on the timeframe you trade, not a wick through it. The same close rule as in the breakout vs fakeout guide.
- A right shoulder clearly below the head. If the right shoulder nearly matches the head, it is closer to a double top or a range.
- A prior uptrend. A head and shoulders in the middle of a sideways range has nothing to reverse.
- The retest fails. Price often rallies back to the neckline from below. If the old support now acts as resistance and price turns down from it, the pattern is much more credible.
- Volume, when you have it. On stocks and many crypto charts, volume that fades on the head and right shoulder and rises on the neckline break supports the read.
The measured target
The classic target is the height of the pattern projected from the neckline:
- Height = head high minus the neckline below it.
- Target = neckline minus that height.
Treat it as a rough guide, not a promise. Price often stops at an older support level before reaching it, so check the chart for support zones in between and take partial profits there if one is close.
Where the stop goes
There are two common choices, and they give very different risk:
- Above the right shoulder. The pattern is clearly wrong if price makes a new high above the right shoulder. Safe, but the stop is far away, and the ratio is often poor.
- Above the retest high, with a buffer. If you enter on a failed retest, the idea is wrong when price closes back above the neckline and the retest high. Tighter stop, better ratio, but a messy retest can take it out.
Whichever you pick, size the position from the stop distance, never the other way round. See how to set a stop loss.
Worked example
These numbers are illustrative and not tied to any live market. They match the diagram above.
After an uptrend, an asset on the 4 hour chart makes a left shoulder near 116.2, a head at 121.2 and a right shoulder near 115.8. The two pullback lows sit around 110, so the neckline is 110.
- Confirmation: a candle closes at 108.2, below the neckline. The pattern is now confirmed, but price is already 1.8 under the line.
- Retest: price rallies back to 110.2, touches the neckline from below and the next candle closes down at 107.5.
- Entry: about 107.5, on the close that shows the retest failed.
- Target: height is 121.2 - 110 = 11.2, so the measured target is 110 - 11.2 = 98.8. Reward is 8.7 per unit.
- Stop option A, above the retest high: 111, above the neckline and the 110.2 retest high with a buffer. Risk 3.5, ratio about 1 to 2.5.
- Stop option B, above the right shoulder: 116.3. Risk 8.8, ratio about 1 to 1. Most traders would skip the trade with that stop, or wait for a better entry.
In the diagram, price falls to about 100 by the last candle, close to the target but not quite there. That is normal: many traders take part of the position off at the first support on the way and move the stop down.
The risk reward calculator checks those ratios, and the position size calculator turns the stop distance into a size for your account.
The inverse head and shoulders (for longs)
Flip everything and you get the inverse head and shoulders, a bottoming pattern after a downtrend: a low (left shoulder), a lower low (head), a higher low (right shoulder), and a neckline through the two rally highs.
- Confirmation: a close above the neckline.
- Entry: on that close, or on a retest of the neckline from above that holds.
- Stop: below the retest low with a buffer, or below the right shoulder.
- Target: neckline plus the pattern height.
The higher low at the right shoulder is the first sign that sellers are losing control, and the close above the neckline is what turns it into a trade.
Common mistakes
- Trading the right shoulder before the break. Selling at the right shoulder "because it looks like a head and shoulders" is guessing. No close below the neckline, no pattern.
- Seeing the pattern everywhere. Three bumps in a choppy range are not a reversal pattern. It needs a clear trend to reverse.
- Ignoring the higher timeframe. A head and shoulders on the 15 minute chart inside a strong daily uptrend is often just a pullback. See how to use multiple timeframes.
- Chasing a break that already ran. If price is far below the neckline when you see it, the stop is far away. Wait for a retest or skip it.
- Treating the target as certain. The measured move is a guide. Plan exits at support zones on the way.
FAQ
Is the head and shoulders pattern bullish or bearish?
The classic version is bearish: it forms at the top of an uptrend and signals a possible reversal down once the neckline breaks. The inverse head and shoulders is the bullish version at the bottom of a downtrend.
How reliable is the head and shoulders pattern?
No pattern works every time, and we do not quote success rates because they depend on the market, the timeframe and how the pattern is defined. It is more useful as a framework: it tells you where the idea is confirmed (neckline close) and where it is wrong (above the retest or right shoulder), so a failure is a small, planned loss.
Can the neckline be sloped?
Yes. Draw it through the two pullback lows even if they are at different prices. A neckline sloping down is usually a weaker market than a flat one. Use the line's value at the moment of the break for the target.
What if price breaks the neckline and comes back above it?
Then the pattern failed. If you are short, this is why the stop sits above the retest high or the right shoulder. A failed head and shoulders often leads to a strong move up, because the sellers who acted on the break have to buy back.
Does it work on crypto, forex and stocks?
The structure works on any chart and any timeframe. It is cleaner on higher timeframes (4 hour, daily) than on very short ones, where noise creates many fake shoulders.
Try it on your own chart
ChartEdge AI reads a chart screenshot and gives you the trend, the key support and resistance zones, the pattern it sees, and a plan with entry, stop and targets. Use it to check whether the neckline on your chart has really broken before you act. Try it with 3 free analyses, no card required. Educational only, not financial advice.