Price rarely moves in a straight line. After a strong move up, it pulls back before the next leg. The question every trend trader asks is the same: where will the pullback stop? Fibonacci retracement is a simple tool that gives you a few candidate zones to watch.
It is not magic and it does not predict anything on its own. Used well, it helps you plan a pullback entry with a clear stop. Used badly, it becomes a set of lines you can always redraw until one of them "worked". This guide shows the first way.
What Fibonacci retracement is
You pick a completed swing, from a swing low to a swing high in an uptrend, and the tool draws horizontal lines at fixed percentages of that move:
- 23.6%: a shallow pullback. Common in very strong trends.
- 38.2%: a moderate pullback.
- 50%: half the move. Not a Fibonacci ratio, but traders watch it anyway.
- 61.8%: a deep pullback, and the level that gets the most attention.
- 78.6%: a very deep pullback. Past this, the move is in doubt.
The math is plain. In an uptrend, the level price is:
Level = swing high - (swing high - swing low) x ratio
With a swing from 100 to 130, the move is 30. The 61.8% level is 130 - 30 x 0.618 = 111.5. The 50% level is 115.
Why traders watch these levels
There is no law of nature that makes price stop at 61.8%. The levels matter for two practical reasons:
- Many traders draw the same lines. Orders cluster around the levels that most people watch, so reactions there are more likely.
- They measure the depth of the pullback. A trend that only gives back 23.6% to 38.2% is strong. A pullback past 78.6% means buyers are losing control.
The strongest Fibonacci levels are the ones that line up with something else on the chart: an old resistance that may now act as support, a rising moving average, or a round number. That overlap is called confluence.
How to draw it correctly
- Pick a clear, finished swing. The move should be obvious at a glance: a clear low, a clear high, and price already pulling back from that high. If you have to squint to find the swing, skip it.
- Uptrend: drag from the swing low to the swing high. Downtrend: from the swing high to the swing low. The levels then sit inside the move, where the pullback happens.
- Wicks or bodies, pick one rule. Most traders use the wick extremes. Whatever you choose, use it every time so you do not adjust the drawing to fit what you want to see.
- Do not redraw after the fact. If price breaks through a level, the drawing was not wrong. The level simply did not hold.
The 4-step plan: level, confluence, trigger, stop
- Trend first. Only use retracements in a trending market: higher highs and higher lows for longs. In a range, the levels are noise. See trend vs range markets.
- Find the confluence zone. Mark the 38.2%, 50% and 61.8% levels, then look for an old support or resistance level near one of them. A Fibonacci level alone is a hint. A Fibonacci level on top of a support level is a zone worth planning around.
- Wait for a trigger. Price reaching the level is not the entry. Wait for it to turn: a close back above the last small swing high of the pullback, or a strong bullish candle off the zone. See how to read candlestick patterns.
- Stop below the zone, size from the stop. The stop goes below the pullback low with a buffer. If price closes below 78.6%, the pullback idea is wrong anyway. Size the position from that stop distance. See how to set a stop loss.
The bearish version is the mirror: draw from swing high to swing low, wait for a rally into the 50% to 61.8% zone near old support turned resistance, enter on a close below the last small swing low, stop above the rally high.
Worked example
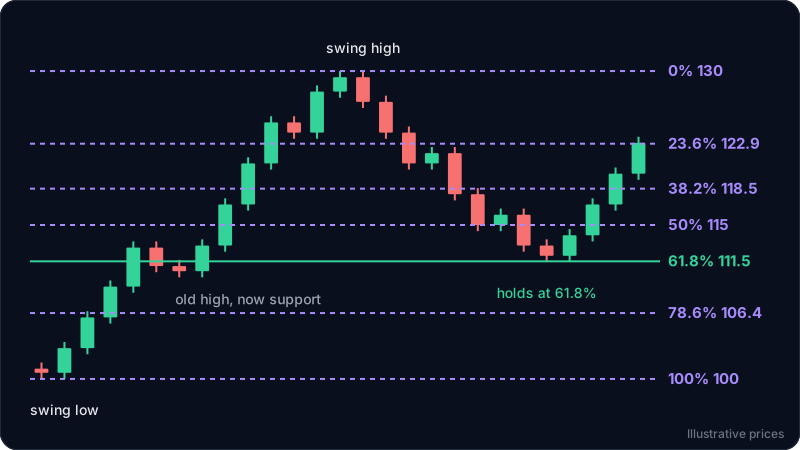
These numbers are illustrative and not tied to any live market. They match the diagram above.
An asset on the 4 hour chart rallies from a swing low at 100 to a swing high at 130. On the way up, it paused around 111 to 113 before breaking higher: that old high is now a possible support.
You draw the retracement from 100 to 130. The levels: 38.2% at 118.5, 50% at 115, 61.8% at 111.5, 78.6% at 106.4. The 61.8% level sits right on the old high. That is the confluence zone.
Price pulls back through 118.5 and 115 without stopping, then the selling slows. The lowest wick reaches about 111.4. The next candle closes at 114, and the one after closes at 117, above the last small swing high of the pullback (about 116.6).
- Entry: about 117, on the close above 116.6.
- Stop: below the pullback low of 111.4 with a buffer, at 110.4. Risk is 6.6 per unit.
- Target 1: the swing high at 130. Reward 13, about 1 to 2.
- Target 2: the 127.2% extension of the swing, 100 + 30 x 1.272 = 138.2. Reward 21.2, about 1 to 3.2.
A common way to handle two targets: take part of the position at 130, move the stop to break even, and let the rest run toward 138. The risk reward calculator checks the ratio and the position size calculator turns the 6.6 stop distance into a size for your account.
Notice what did the work. The Fibonacci level said where to look. The old high made the zone worth trusting. The close above the pullback's swing high was the entry. Without the trigger, there was no trade.
Fibonacci extensions for targets
Extensions project how far the next leg might go, using the same swing. The common ones are 127.2% and 161.8%. In an uptrend:
Extension = swing low + (swing high - swing low) x ratio
From 100 to 130, the 161.8% extension is 100 + 30 x 1.618 = 148.5. Treat extensions like any target: check them against real resistance on the chart, and take profits on the way rather than waiting for the exact line.
Common mistakes
- Drawing on a messy swing. If the low and high are not obvious, every trader draws something different and the levels mean nothing.
- Buying the touch. Price reaching 61.8% is not a signal. Many pullbacks slice through it. Wait for the turn.
- Using retracements in a range. Without a trend, there is nothing to retrace.
- Stop right on the level. Price often wicks a little past a level before turning. Give the stop room below the pullback low.
- Redrawing until it fits. Moving the anchor points after the fact makes the tool look perfect in hindsight and useless in real time.
FAQ
Which Fibonacci level is the most important?
The 61.8% and 50% levels get the most attention, with 38.2% close behind in strong trends. No single level is reliable on its own. The level that lines up with old support or resistance is the one to watch.
Do you draw Fibonacci from wick to wick or body to body?
Most traders use the wicks, the true high and low of the swing. Using bodies is fine too. The rule that matters is consistency: pick one and do not switch to make a level fit.
What is the golden pocket?
It is the zone between the 61.8% and 65% retracement levels. Some traders treat it as the prime area for a deep pullback entry. It works the same as any level: stronger with confluence, and only after a trigger.
Does Fibonacci retracement work on crypto, forex and gold?
The tool works on any chart, because it only measures a swing. Crypto moves fast and trades all week, so swings on very low timeframes are noisy. On forex and gold, the 1 hour and 4 hour charts usually give cleaner swings.
What happens if price breaks the 78.6% level?
The pullback has become too deep for the trend idea. Most traders treat a close below 78.6% as a sign that the trend may be failing, and stand aside until a new structure forms.
Try it on your own chart
ChartEdge AI reads a chart screenshot, including the Fibonacci levels you drew, and gives you the trend, key levels and a plan with entry, stop and targets. Use it to check whether your pullback sits at a level that matters. Try it with 3 free analyses, no card required. Educational only, not financial advice.