A demand zone is an area where price sat for a short time and then left fast and far to the upside. A supply zone is the same thing to the downside. The idea is simple: something made price leave that area in a hurry, and when price comes back for the first time, the same buyers or sellers may still be there.
An order block is the name smart money concept traders give to a very specific version of this: the last opposite candle before a strong move. The last red candle before a big rally is a bullish order block. The last green candle before a big drop is a bearish order block. Different words, very close idea.
This guide shows how to mark these zones on a chart screenshot, how to tell a strong zone from a weak one, where the entry, stop and target go, and walks through a full example.
What a zone looks like
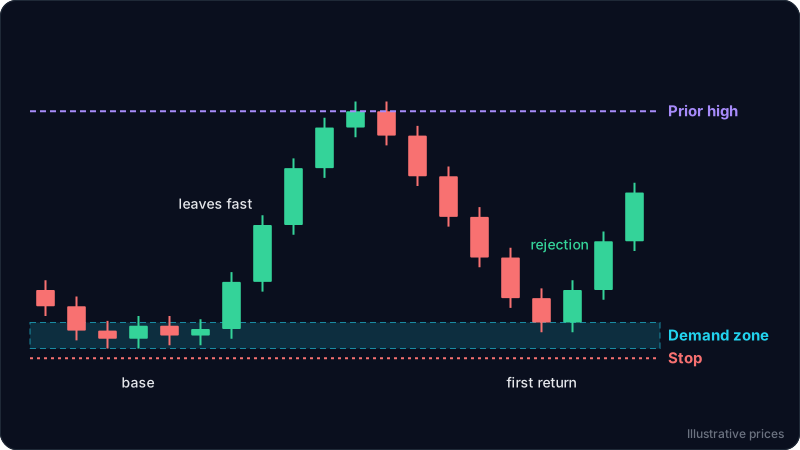
Every zone has three parts:
- The base. A few small candles moving sideways in a tight area. This is where orders built up.
- The departure. A fast move away from the base: large candles in one direction with small wicks. The faster and further price leaves, the more imbalance there was.
- The return. Later, price comes back to the base. This is the moment traders watch.
A demand zone sits below the current price and can act like support. A supply zone sits above and can act like resistance. The difference with a classic support line is that a zone is built from where price left quickly, not from where it bounced several times.
How to mark a zone
On your chart screenshot:
- Find a strong move: three or more large candles in a row, clearly bigger than the candles around them.
- Look at where that move started. Find the small candles just before it: that is the base.
- For a demand zone, draw the bottom of the zone at the lowest wick of the base and the top at the highest body of the base. For a supply zone, the top is the highest wick and the bottom is the lowest body.
- For an order block, use only the last opposite candle before the move: its low to its high (or its open to its low, if you want a tighter zone).
Keep zones narrow. A zone that covers half of the chart is not a zone, it is a guess. If the base is too wide, use the order block version instead.
Which zones are worth trading
Most charts are full of bases. A few filters cut the list down:
- A strong departure. The move away should be clearly faster than normal for that chart. A slow drift out of a base does not show much imbalance.
- Fresh. The first return to a zone is the one traders care about. Each time price comes back, more of the waiting orders get used up. After two or three tests, a zone is weak.
- With the trend. A demand zone in an uptrend (higher highs and higher lows) carries more weight than one in a downtrend. See trend vs range markets.
- Room to the next zone. If a supply zone sits just above your demand zone, there is no space for the trade to work. Check the distance before you plan anything.
- Higher timeframe agreement. A 15 minute demand zone inside a 4 hour demand zone is stronger than one sitting under a 4 hour supply zone. See how to use multiple timeframes.
Entry, stop and target
There are two common ways to enter on the first return to a demand zone:
- Limit order at the top of the zone. You get the best price and you do not miss fast reactions, but you have no confirmation. If the zone fails, you are in.
- Wait for a rejection. Let price touch the zone, then enter after a candle closes back up, away from the zone (a hammer or a strong green close). The entry is worse, but you have proof that buyers reacted. The candlestick guide shows what a rejection candle looks like.
The stop goes just beyond the zone: below the bottom of a demand zone, above the top of a supply zone, with a small buffer. If price closes through the whole zone, the idea was wrong. See how to set a stop loss.
The target is usually the start of the move or the next opposite zone: the prior high for a demand zone trade, the prior low for a supply zone trade.
Worked example
These numbers match the diagram above. Prices are illustrative.
- Base: four small candles between 100.4 and 102. That is the demand zone.
- Departure: price leaves in five large green candles to 115.
- Return: price drops back and a candle closes at 102, inside the top of the zone. This is the first test.
- Rejection: the next candle closes at 104, back above the zone.
- Entry: 104, on that close.
- Stop: 99.8, just below the zone. Risk is 4.2 per unit.
- Target: 115, the prior high. Reward is 11 per unit.
- Ratio: 11 / 4.2, about 1 to 2.6.
The risk reward calculator checks that ratio, and the position size calculator turns the 4.2 point stop into a size for your account.
With a limit order at 102 instead, the risk would have been 2.2 and the ratio about 1 to 5.9, but you would have bought without any sign that buyers were still there.
A supply zone trade is the mirror: a base, a fast drop, the first return up into the base, a rejection close back down, a stop above the zone and the prior low as the target.
Zones vs support and resistance
They overlap a lot. A classic support and resistance level is drawn where price turned several times. A supply or demand zone is drawn where price left fast, and it is strongest before it has been tested. In practice, the best areas are often both: a fresh zone that also lines up with an old support or resistance level.
Common mistakes
- Marking every base. Without a strong departure, a small range is just noise.
- Trading the fourth test. Each return weakens a zone. If price keeps coming back, it is more likely to break through.
- Zones that are too wide. A wide zone forces a wide stop, and the ratio stops making sense.
- Fighting the trend. Buying a demand zone in a clear downtrend means betting against every seller above you.
- Forgetting the size. A zone trade with a stop 3 times wider than usual needs a position 3 times smaller. See position sizing for a $1,000 account.
FAQ
Are order blocks and demand zones the same thing?
Close. A demand zone is the whole base before a strong rally. A bullish order block is only the last red candle before that rally, so it is usually narrower. Both describe an area where price left in a hurry.
Do supply and demand zones work on crypto, forex and gold?
The structure exists on any chart and any timeframe. Fast markets like crypto produce many zones on low timeframes, and many of them fail, so the filters above (fresh, with the trend, strong departure) matter even more.
What happens when a zone breaks?
If price closes clearly through a demand zone, it has failed. The broken zone often flips and acts as supply on the next return, the same role reversal you see with support and resistance.
How often do these zones hold?
We do not quote a success rate. It depends on the market, the timeframe, and how each trader marks the zone. Treat a zone as a place to plan a trade with a stop, not as a guarantee.
Try it on your own chart
ChartEdge AI reads a chart screenshot and gives you the trend, the key support and resistance zones, and a plan with entry, stop and targets. Use it to check whether the zone you marked lines up with the levels it finds before you act. Try it with 3 free analyses, no card required. Educational only, not financial advice.